
The Smartphone as a Sound Level Meter: Visualizing Acoustical Beats
El teléfono inteligente como instrumento de medida del nivel sonoro: visualización del batido acústico
Abstract
Acoustics is a topic in first year Physics courses for engineering
students. In this respect, we present in this work a
simple experiment to study acoustic beat phenomenon. The
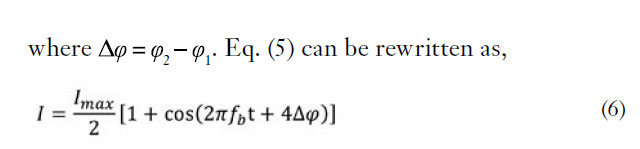
superposition of sound waves of slightly different frequencies
is captured with the microphone of a smartphone which is
placed equidistantly from two speakers which are connected
at the same time to AC generators. The smartphone is
used here as a measuring instrument. Data registered from
the sound level versus time were collected and exported to
a «.csv» file for further analysis by means of a free Android
application. Based on these data and applying a simple graphing
analysis the frequency of the beat was determined and
compared with the frequency difference set at the AC generators.
Percentage discrepancies within 1% were obtained. This
indicates the efficacy of the method used.
Keywords
Sound level, smartphones, acoustic beats.
Resumen
En este trabajo presentamos un nuevo experimento de acústica
para estudiantes de primer año de ingeniería. Hemos diseñado
un montaje muy simple para estudiar la superposición
de ondas de sonido de frecuencias ligeramente diferentes
(batido acústico). Hemos utilizado el micrófono del teléfono
inteligente para captar las ondas de sonido emitidas por dos
altavoces ubicados a ambos lados del mismo y a distancias
equidistantes. Los altavoces a su vez están conectados a generadores
de corriente alterna. En esta experiencia, el teléfono
es utilizado como instrumento de medida. Los resultados
del nivel sonoro (en dB) en función del tiempo se exportaron a
un fichero “.csv” a través de una aplicación libre para Android.
A partir de los datos registrados y un análisis gráfico sencillo,
se obtuvo la frecuencia del batido. El valor determinado de
este modo se comparó con la diferencia de frecuencias entre
los generadores y se obtuvo una discrepancia porcentual
menor del 1%. El buen acuerdo alcanzado indica la eficacia
del experimento presentado para el estudio docente de este
fenómeno acústico
Palabras clave
Nivel sonoro, teléfonos inteligentes, batido acústico.
Recibido / received: 26.07.2017. Aceptado / accepted: 10.11.2017.
Introduction
Portable devices’ sensors offer a wide range of possibilities for the development of Physics teaching experiments in early years. For instance, digital cameras can be used to follow physical phenomena in real time since distances and times can be derived from the recorded video (Monsoriu 2005). Wireless devices such as wiimote have been also used in Physics teaching experiments (Tomarken 2012). The wiimote carries a three axis accelerometer which communicates with the console via BluetoothTM. More recently, smartphones have been incorporated to this variety of portable devices (Kuhn 2012, CastroPalacio 2013). For instance, the acceleration sensor of the smartphones has been used to study mechanical oscillations, at both the qualitative (Kuhn 2012) and the quantitative levels (CastroPalacio 2013). These works show very simple experiments in which the smartphone itself is the object under study. The acceleration data are captured by the acceleration sensor of the device and collected by the proper mobile application.
All smartphones are equipped with a microphone, which can be used to record sounds with a sample rate of 44100 Hz, and in some new devices up to 48000 Hz. This allows to analyze different acoustic phenomena with the smartphone microphone (Kuhn 2013a). The sound frequency spectrum captured by the smartphone microphone can be analyzed with a number of free applications, such as Audio Spectrum Monitor (Yamaoka 2017) and Spectrum Analyzer (Johnson 2017). Also, the fundamental frequency of a sound wave can be measured with very high precision, which allows to study a frequencymodulated sound in Physics laboratory (GómezTejedor 2015) and the Doppler Effect for sound waves (GómezTejedor 2014).
Using smartphone devices, several methods to measure the velocity of sound have been proposed. For instance, by means of the Doppler effect using ultrasonic frequency and two smartphones the speed of sound can be determined with an accuracy of about 5% (Klein 2014). Based on the distance between the two smartphones and the recording of the delay between the sound waves traveling between them, the actual speed of sound can be obtained (Parolin 2013). Using economic instruments and a couple of smartphones, it is possible to see nodes and antinodes of standing acoustic waves in a column of vibrating air and to measure the speed of sound (Parolin 2015). By the study of destructive interference in a pipe it is also possible to adequately and easily measure the speed of sound (Yavuz 2016). A sonometer application can be used to measure the resonance in a beaker when waves with different wavelengths are emitted by the smartphone speaker. This application can also be used to measure and analyze Doppler effect, interferences, frequencies spectra, wavelengths, etc. or to study other phenomena in combination with some other fundamental physics laboratory equipment such as Kundt or Quincke tubes (González 2015). On the other hand, measurements with the smartphone microphone can be used to analyze physical process not directly related with acoustic. The sounds made by the impacts of a ball can be recorded with the microphone. The impacts result in surprisingly sharp peaks that can be seen as time markers. The collected data allow the determination of gravitational acceleration (Schwarz 2013).
In order to measure the acoustic beat, two mobile phones can be placed at a short distance from each other and then play previously recorded tones with a constant frequency with the MP3 function. The signal can be captured using a microphone and by the linein of a sound card in a computer, and then, the recorded signal can be analyzed with suitable audio software (Kuhn 2013b). In a similar way, three smartphones can be used to analyze the acoustic beat: two of them produce the sine tones with slightly different frequencies and the third device detects and analyzes the overlapping oscillation (Kuhn 2014). In this kind of experiments, oscillogrammes are recorded and the acoustic beats are derived from the varying envelope amplitude.
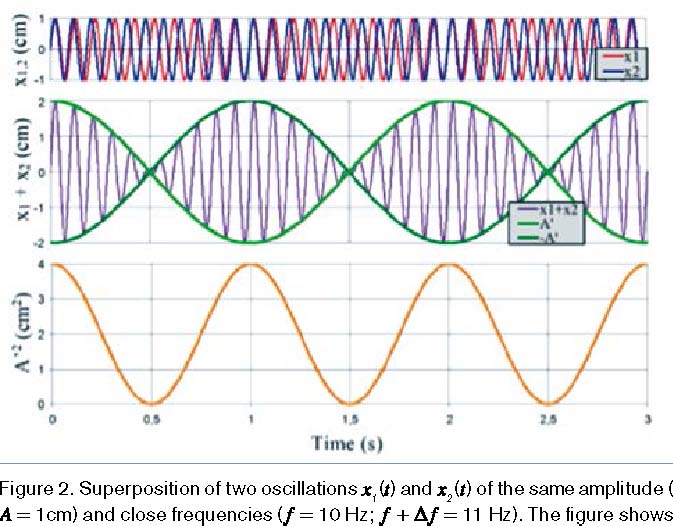
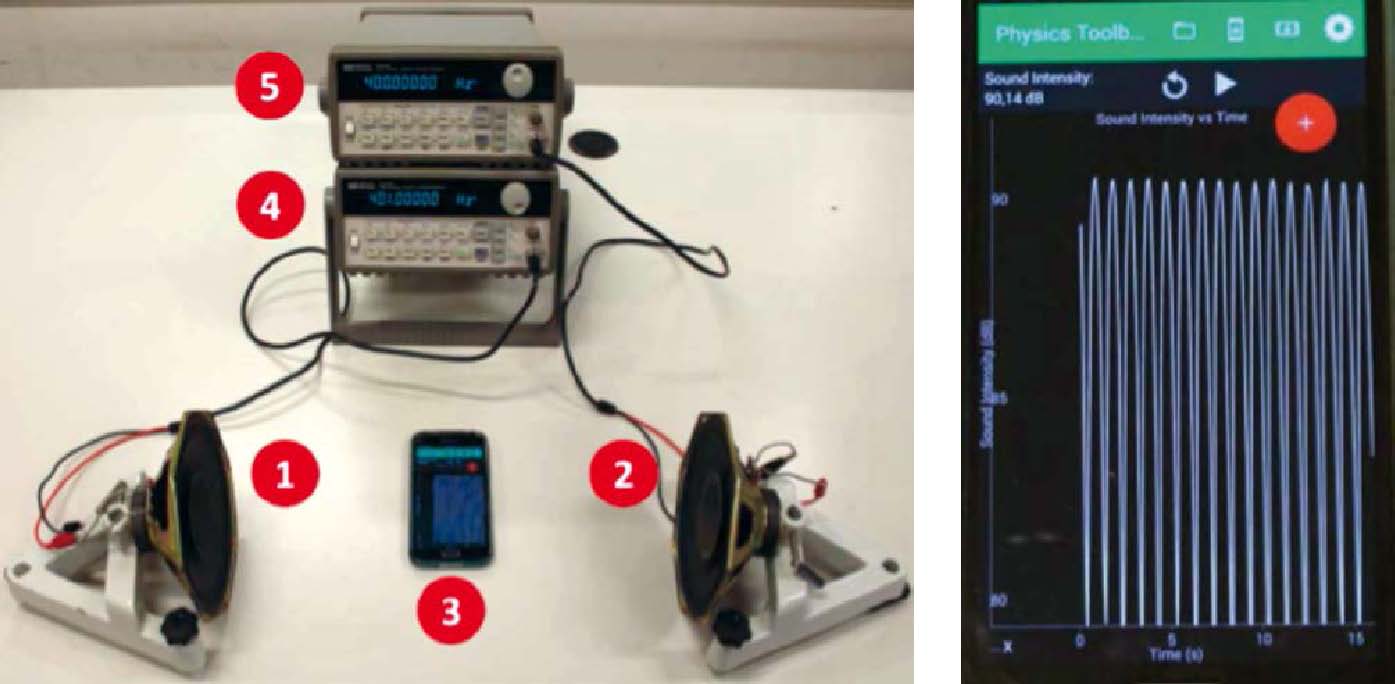
In the present work, a more intuitive procedure is presented in order to characterize acoustic beats with a smartphone. When two sound waves of very close frequencies are superimposed, a “vibrating” tone is perceived. This is the basic principle behind the tuning of musical instruments. Instead of using oscillogrammes, we propose to capture the perceived vibrating tone by using the smartphone as a sonometer. The sound waves are generated by two independent speakers connected to AC generators, although two other smartphones may be also used to generate the sine tones. By means of the free application Physics Toolbox Sound Meter (see Fig. 1) (Vieyra 2017), the students are able to measure the sound intensity (in dB) of the acoustic beats as a function of time.
The resulting sound intensity variations are directly displayed on the mobile screen and the frequency beat can be quantitatively obtained. Moreover, the recorded sound levels can be exported to a PC for a more quantitative analysis, i.e. by email, cable or Bluetooth connection. In this way, the varying intensity of the vibrating tone is derived from the sound level measurements and fitted to a harmonic function in order to accurately obtain the corresponding frequency beat. The results are compared with the frequency difference of the superimposing AC signals, and a very good agreement is obtained.
Basic theory
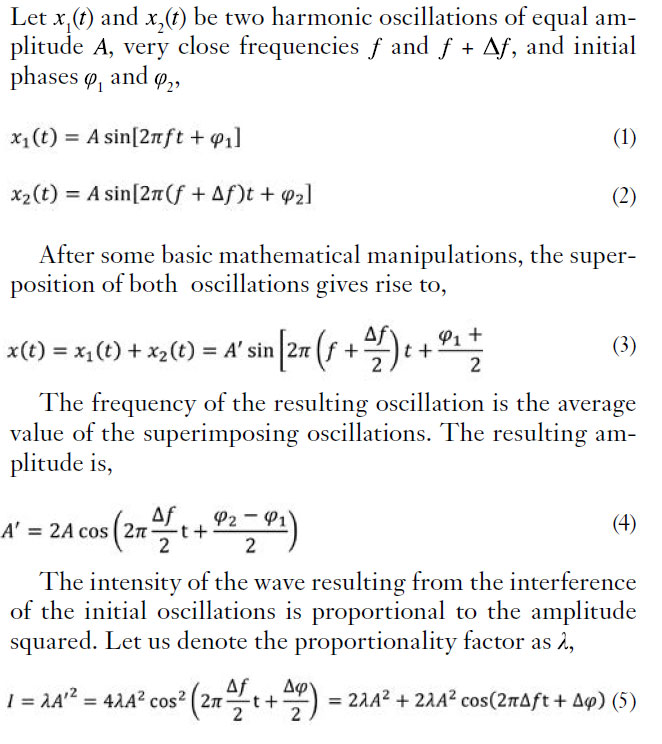

Figure 1. Screenshots of the Physics Toolbox Sound Meter App (Vieyra 2017). The application allows measuring the sound level instantaneously as shown in the image on the left. The application also allows recording the sound level as a function of time. As an example, the image on the right shows the evolution of the sound level produced by a tuning fork.
Experimental results
The experimental setup used to carry out the experiments is shown in Fig. 3. It consists of two AC generators (model 33120A of Hewlett Packard), two identical speakers (model AD70800/M4 from Philips) facing each other, and the necessary cables to get all appliances connected. Finally, the smartphone is placed in the midway between both speakers. Two other smartphones with an application for generating a sine tone, could be also used. The Android application Physics Toolbox Sound Meter, capable of measuring the sound level of the waves coming from the speakers, was previously installed on the smartphone. First, the same effective voltage is set at both AC generators. The speakers were fed with signals of similar frequencies and within the human audible range. We have used the frequencies 400 Hz and 401 Hz in the example shown in Fig. 3. After checking that the beat can be heard, the mobile application is turned on. The beat oscillations are then observed on the mobile screen (Fig. 4). It can be verified that, even when there is a small level of background noise, and the sampling frequency can not resolve the minimum values of the signal, the periodicity of the oscillations are still observed.
After recording the sound level for several seconds, the registered data, previously exported to a .csv file, can be sent to a PC for further analysis. For this purpose, different ways can be used, namely, cable connection, Bluetooth or email. In order to derive the beat frequency, the first step is to convert the registered sound level β in dB to the sound intensity – in W/m2 using the following expression (Tipler 2015),
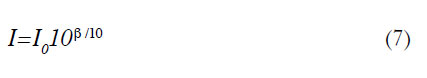
where
I0= 10−12W/m2 is the standard value of the intensity threshold of the audible range in humans. Later, an interval of 5 s is chosen from the central part of the time series recorded by the smartphone. This segment of data for I(t) is fitted using a leastsquares algorithm to the Eq. (6). The only relevant quantity to this work is the beat frequency, fb, although the other two parameters (Imax and δ can be also obtained from the fitting procedure. The use of sine or cosine functions in the fitting does not make any difference since it affects only the initial phase and not the frequency of the acoustic beat which is our objective function. Based on the values of frequency obtained from the fitting, the frequency of the beat fb can be determined and compared with δf which is the difference of the frequencies from the AC generators.
Figure 5 shows the results for a frequency difference in the AC generator as 1Hz. First, the central interval of the time series of the sound level (in dB), registered with the smartphone is represented in Fig. (5a). The resulting beat frequency is fb= 1.008 (0.002) Hz with a regression coefficient R2= 0.90. The discrepancy with respect to the frequency difference in the AC generator is 0.8%.
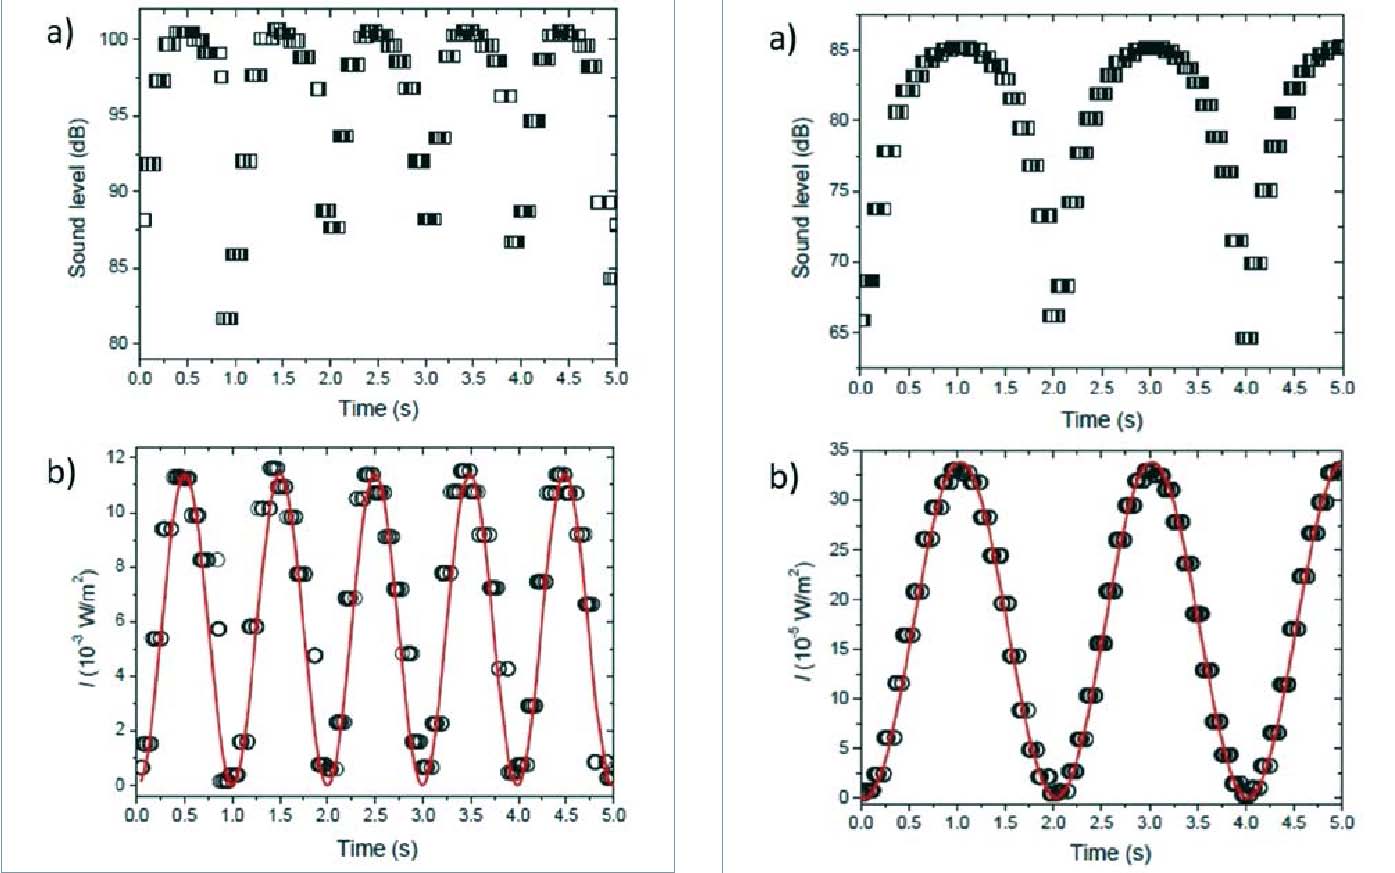
In order to provide further verification of the experimental procedure, several combinations of close frequencies (fb = δf) are used. For example, Figure 6 shows the results for frequency differences in the AC generators of δf= 0.5 Hz, with an experimental frequency beat of fb= 0.5020 (0.0004) Hz and a regression coefficient R2 = 0.99. The quality of the fit can be seen in the value of R2 which is close to 1. In this case, the discrepancy with respect to the expected value is 0.4%.
We repeated the proposed experimental procedure to characterize the acoustic beats with frequency differences in the AC generator between 0.5 and 1.5 Hz and main frequencies between 400 and 700 Hz. In all cases, the discrepancies were lower than 1%. Therefore, the precision of the frequency measurements was reasonably enough to capture the acoustic beat phenomenon. Nevertheless, the aim of this work is to show a new Physics experiment based on a smartphone, a very familiar device to the students
Conclusions
A new Physics teaching experiment for first years engineering students has been presented in this work. A smartphone with an AndroidTM application has been used as sonometer to measure the sound intensity of the beats formed by the superposition of sound waves generated at speakers connected to AC generators. The interfering waves had the same amplitude and very close frequencies. The time series generated from the measurements with the smartphone are further analyzed by the students in order to determine the frequency of the beats. The beat frequency obtained from the smartphone data reproduces the value calculated from the AC generators frequencies within 1%. The use of smartphones in Physics teaching experiments is a very motivating experience for the students.
Acknowledgments
The authors would like to thank the Institute of Education Sciences of the Universitat Politècnica de València (Spain), for the support to the research groups on teaching innovation MoMa and e-MACAFI and for supporting the Project PIME/2015/B18 which gave rise to this work.
References
Castro-Palacio JC, Velázquez-Abad L, Giménez MH, Monsoriu JA (2013). Using a mobile phone acceleration sensor in physics experiments on free and damped harmonic oscillations. Am. J. Phys.
81: 472-5.
Gómez-Tejedor JA, Castro-Palacio JC, Monsoriu JA (2014). The acoustic Doppler effect applied to the study of linear motions. Eur. J. Phys. 35: 025006.
Gómez-Tejedor JA, Castro-Palacio JC, Monsoriu JA (2015). Frequency analyser: A new Android application for high precision frequency measurement. Comp. App. Eng. Educ. 23: 471-6.
González MA, Martín ME, Llamas C, Martínez O, Vegas J, Herguedas M, Hernández C (2015). Teaching and learning Physics with Smartphones.
J. Cases on Inf. Tech. 17: 31-50.
Johnson B (2017). Spectrum Analyzer. Available in: https://play.google.com/store/apps/details?id =com.raspw.SpectrumAnalyze (retrieved on July 26th, 2017).
Klein P, Hirth M, Gröber S, Kuhn J, Müller A (2014). Classical experiments revisited: smartphones and tablet PCs as experimental tools in acoustics and optics. Phys. Educ. 49: 412-8.
Kuhn J, Vogt P (2012). Analyzing spring pendulum phenomena with a smart-phone acceleration sensor. Phys. Teach. 50: 504-5.
Kuhn J, Vogt P (2013a). Analyzing acoustic phenomena with a smartphone microphone. Phys. Teach. 51: 118-9.
Kuhn J, Vogt P (2013b). Applications and examples of experiments with mobile phones and smartphones in physics lessons. Frontiers in Sensors 1: 67-73.
Kuhn J, Vogt P, Hirth M (2014). Analyzing the acoustic beat with mobile devices. Phys. Teach. 52: 248-9.
Monsoriu JA, Giménez MH, Riera J, Vidaurre A (2005). Measuring coupled oscillations using an automated video analysis technique based on image recognition. Eur. J. Phys. 26: 1149-55.
Parolin SO, Pezzi G (2013). Smartphone-aided measurements of the speed of sound in different gaseous mixtures. Phys. Teach. 51: 508-9.
Parolin SO, Pezzi G (2015). Kundt’s tube experiment using smartphones. Phys. Educ. 50: 443-7.
Schwarz O, Vogt P, Kuhn J (2013). Acoustic measurements of bouncing balls and the determination of gravitational acceleration. Phys. Teach. 51: 312-3.
Tipler P A, Mosca G P (2005). Physics for Scientists and Engineers with Modern Physics. Sixth Edition, Reverté, Barcelona (2005).
Tomarken SL, Simons DR, Helms RW, Johns WE, Schriver KE, Webster MS (2012). Motion tracking in undergraduate physics laboratories with the Wii remote. Am. J. Phys. 80: 351-4.
Vieyra, C, Vieyra R (2017). Available in: https:// play.google.com/store/apps/details?id=com. chrystianvieyra.physicstoolboxsuite (retrieved on July 26th, 2017)
Yamaoka T (2017). Audio Spectrum Monitor. Available in: https://play.google.com/store/apps/ details?id=my.sample (retrieved on July 26th, 2017).
Yavuz A, Temiz BK (2016). Detecting interferences with iOS applications to measure speed of sound. Phys. Educ. 51: 015009.