Solving power flow problems through the Gauss-Seidel method using Microsoft Excel. Case applied to the course on Generation, Transmission, and Distribution of Electric Power
Resolución de problemas de flujo de energía con Microsoft Excel empleando el método de Gauss-Seidel. Caso aplicado a la asignatura Generación, Transmisión y Distribución de Energía Eléctrica
Carlos Vargas-Salgado1, Manuel Alcázar-Ortega1, David Alfonso-Solar2 y Elías Hurtado-Pérez1
Abstract
Analysis of electric power systems is required to predict a grid’s behavior before its design. Several commercial simulators give such information, but it is necessary to pay to use it. This work presents a method to solve electric power systems by applying Gauss-Seidel and MS Excel. The modulus and argument of the voltage and the active and reactive power are estimated for every bus. The results conclude that, compared to other software results, the presented method can analyze electric power systems with low uncertainty.
Keywords: Electric power systems, simulation, generation transmission and distribution of electricity, Gauss-Seidel.
Resumen
Para predecir el comportamiento de una red, antes de su diseño, es necesario llevar a cabo el análisis del sistema. Ciertos simuladores proporcionan dicha información, previo pago por su uso. Este trabajo presenta un método para resolver sistemas eléctricos de potencia aplicando Gauss-Seidel mediante MS Excel. Se estima el módulo y el argumento de la tensión, así como la potencia activa y reactiva de cada bus. Se concluye que el método permite analizar sistemas eléctricos de potencia con un bajo error, comparando los resultados con softwares comerciales.
Palabras clave: Sistemas eléctricos de potencia, simulación, generación, transporte y distribución de electricidad, Gauss-Seidel.
Recibido / received: 17/06/2022. Aceptado / accepted: 16/10/2022.
1Departamento de Ingeniería Eléctrica, Universitat Politècnica de València, Camino de Vera, s/n, edificio 5E, planta baja. 46022 Valencia (España); e-mail:ca******@********pv.es, ma******@*****pv.es, ej*******@*****pv.es 2Departamento de Termodinámica Aplicada, Universitat Politècnica de València, Camino de Vera, s/n, edificio 5J, 2ª planta. 46022 Valencia (España); e-mail: da****@*****pv.es
Autor para correspondencia: Carlos Vargas-Salgado; e-mail: ca******@********pv.es
Introduction and objectives
For a balanced three-phase system in steady-state to operate correctly, the following conditions must be met: that generation covers demand plus losses, the voltages at the buses must be close to the rated value, and the generators must operate within the specified limits of active and reactive power, and the transmission lines and transformers must not operate overloaded (Duncan Glover et al., 2011; PowerWorld. The visual approach to electric power systems, n.d.).
One of the methods to solve the power flow problem is Gauss-Seidel. The method calculates the voltage at each bus based on the previous iteration’s available voltage and power values through an iterative procedure. Giving an initial value and using the result of the last iteration as the value in successive iterations, it is possible to find the solution of the problem(- Cañas Peñuelas et al., 2020). Applying the Gauss-Seidel method, the problem can be solved using MS Excel. Some commercial software allows the calculation of power flows; one of the best known is the Powerworld® simulator. However, this type of applications is expensive.
This work explains how to solve power flow problems in complex systems by modeling Excel for matrix calculation and complex numbers. The Gauss-Seidel method solves power flows using MS Excel and compares the results obtained to the Power world simulator commercial software. The MS Excel method is applied to the course on “generation, transmission, and distribution of electric power” belonging to the Master of Industrial Engineering at the Polytechnic University of Valencia, Spain.
Method
The power flow problem requires calculating the modulus and argument of the voltage and the active and reactive power at each power system bus under stationary conditions (Alcázar-Ortega et al., 2020). Each bus has four magnitudes: voltage modulus, voltage argument, and active and reactive power. Two of these variables are known at each bus, and the other two are unknown, so they must be calculated. MS Excel is a powerful tool able to solve complex problems in engineering (Alcázar-Ortega et al., 2019). This methodology applies the Gauss-Seidel method to solve the problem according to the following procedure:
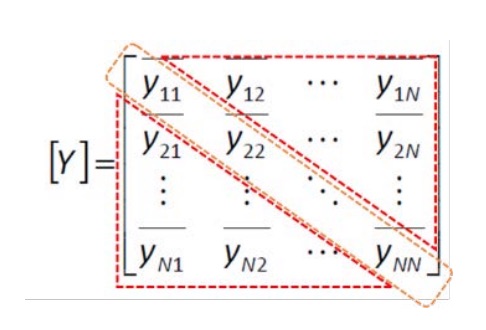
1. The admittance matrix of the system is determined. The components of the diagonal are calculated. Since the matrix is symmetric, it is necessary to calculate the elements above the diagonal and then transpose them (Fig. 1). The diagonal components are calculated by the equation Eq. 1. Off-diagonal components are calculated using the equation Eq. 2.
 2. Construct a matrix of the same dimensions as the admittance matrix containing only the real part (G, Conductances) of all the matrix elements. Build another matrix that contains only the imaginary part (B, Susceptances).
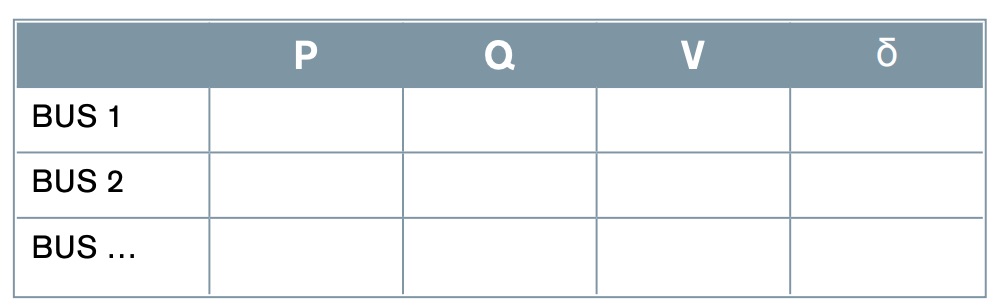
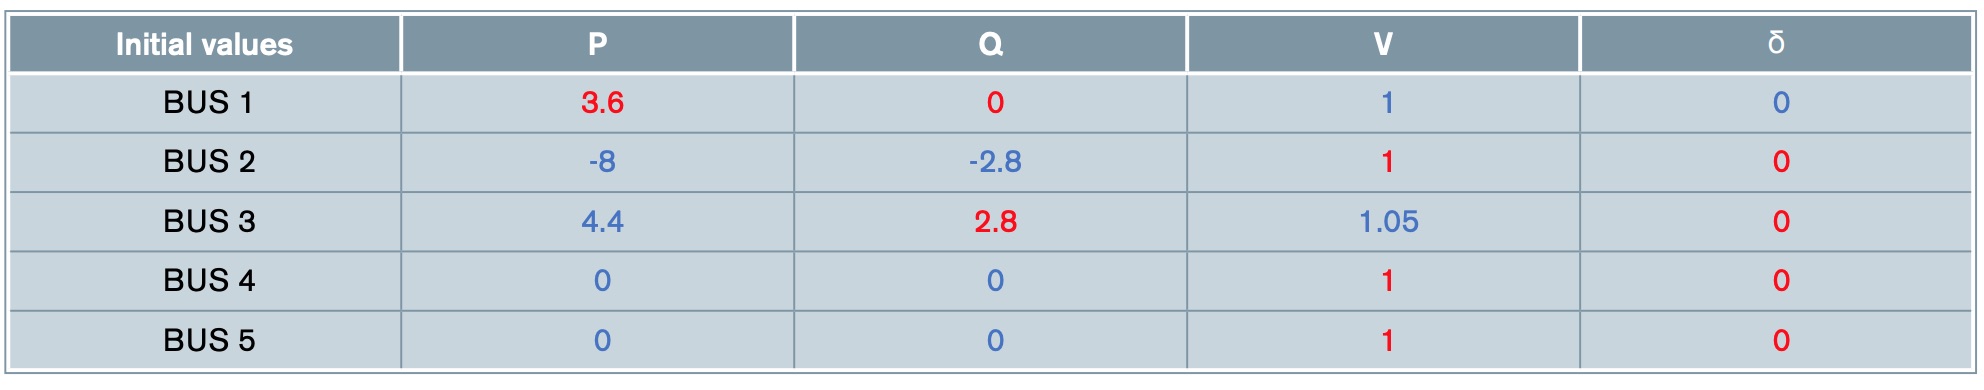
3. Locate in Table 1 the initial values of voltage and power of the system. Assign values to unknown information. Such values will be the starting point in the iterative process.
4. Solve the equations to estimate the unknown values of each bus, setting the values of the known parameters depending on the type of bus.
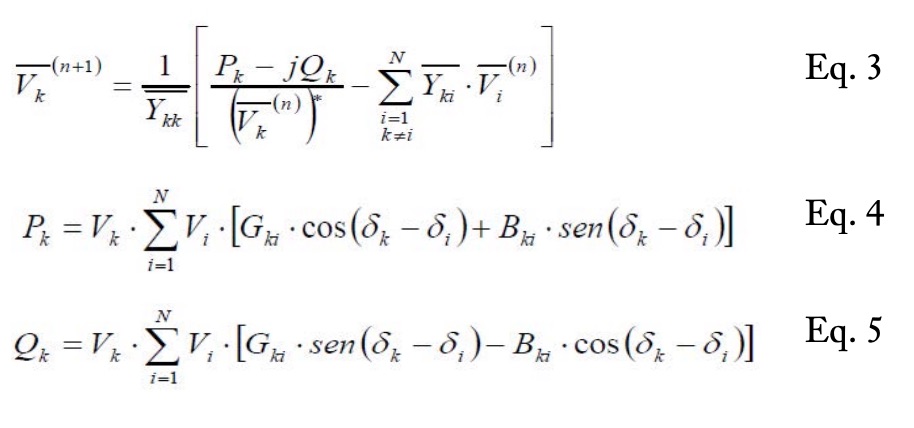
5. Fill in the Excel sheet by introducing the equations of the voltages (Eq. 3) and the powers (Eq. 4 and Eq. 5) to be calculated and referring to the initial parameters of the table created in point 4. An initial estimate of the bus voltages V0k must be made. This value is usually set to 1 p.u. and the angle, to zero degrees (Alcazar-Ortega et al., 2019; Cañas Peñuelas et al., 2020).
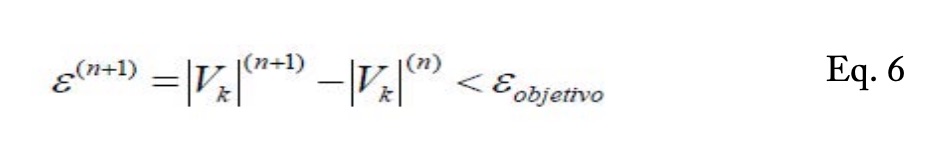
 Calculate the following iteration of the value at all load buses. To do this, select the row containing iteration 1 and drag it to the following row, replacing the references to the initial values of the matrix created by referencing the values of the first iteration. 7. Drag until ? is small enough. Each new row will result in a new iteration.
 Study case
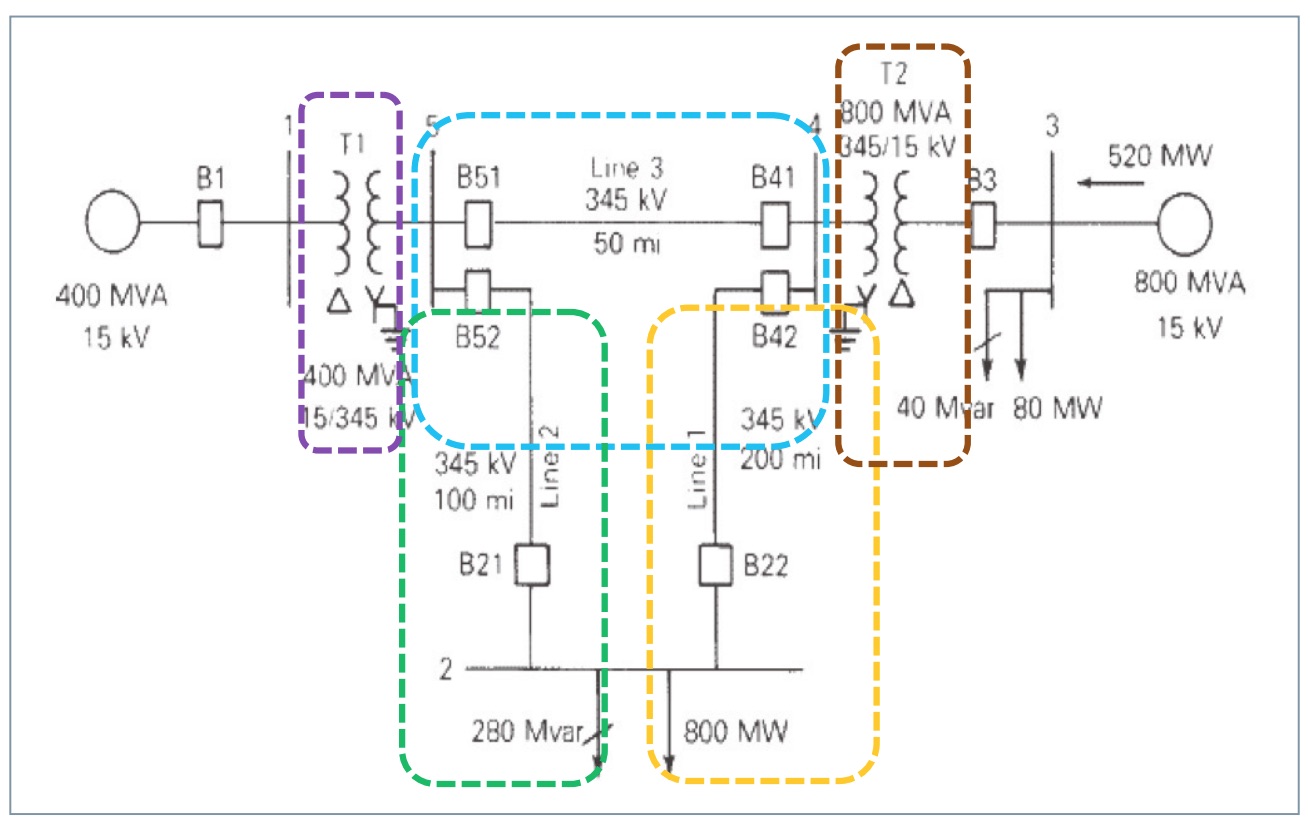
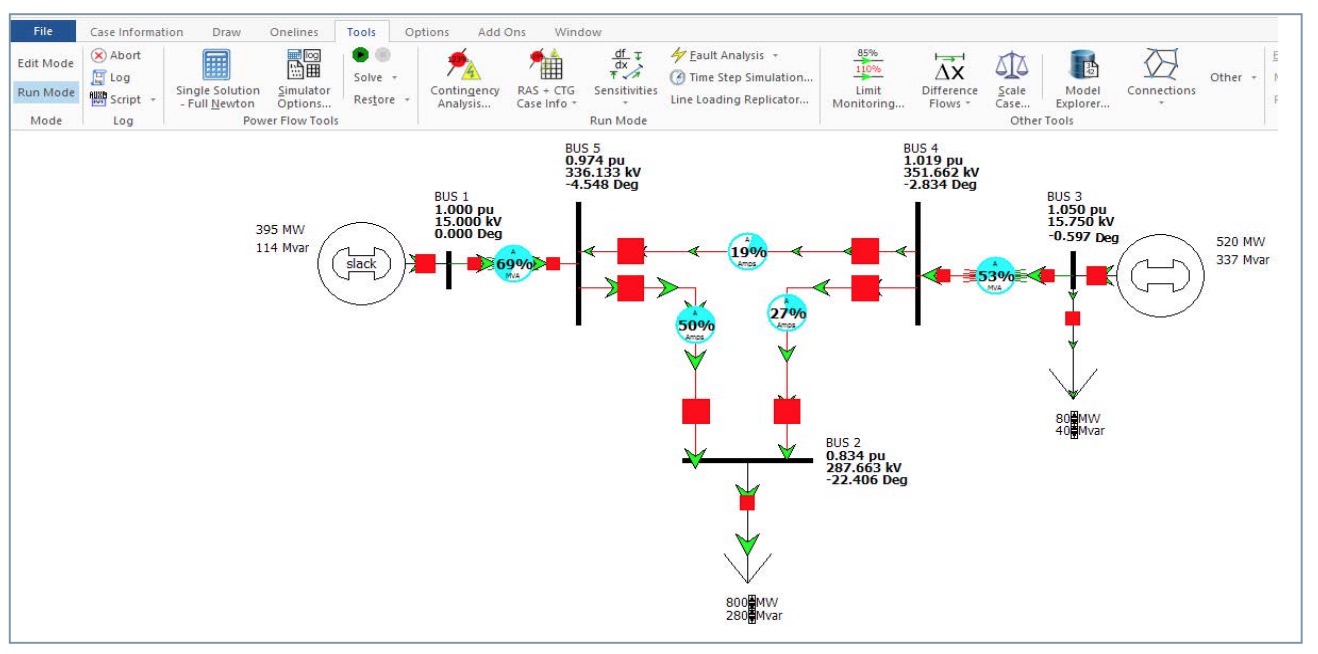
The previous procedure is applied to the case study shown in Fig. 2 and explained below:
• There are two loads connected at buses 2 and 3, with the load at bus 2 equal to 800+j280 MVA and the load at bus 3 equal to 80+j40 MVA.
• The demand for these loads is covered by two 400 and 800 MVA nominal power generators connected at buses 1 and 3, respectively.
• The generator connected to bus 1 has an automatic generation control. The generator connected to bus 3 maintains a constant power equal to 520 MW.
• The generator can regulate the reactive energy injected at bus 3 between 400 and -280 MVAr, which maintains the voltage at a constant value equal to 1.05 p.u.
• Each generator is connected to the grid through a transformer that increases the voltage from 15 to 345 kV.
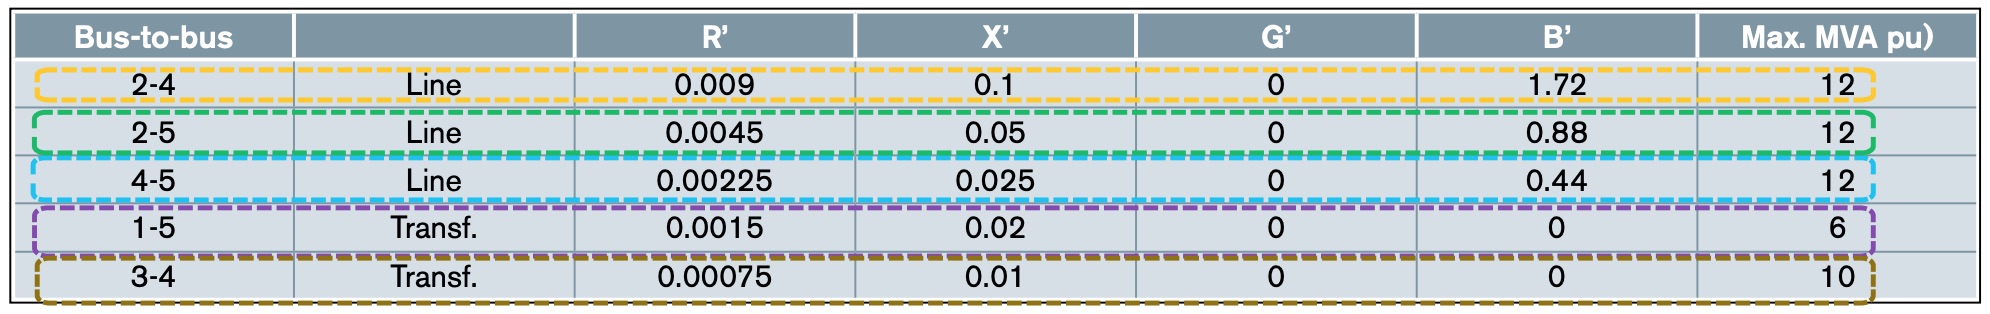
The values of the resistance (R), reactance (X), conductance (G), and susceptance (B), and the maximum power for each bus and transformer are shown in Table 2. This information is used as input data to solve the problem. The summary of input data and unknown variables is shown in Table 3. The initial estimate of unknown node stresses is usually set to 1 p.u. and an angle at zero degrees.
Results
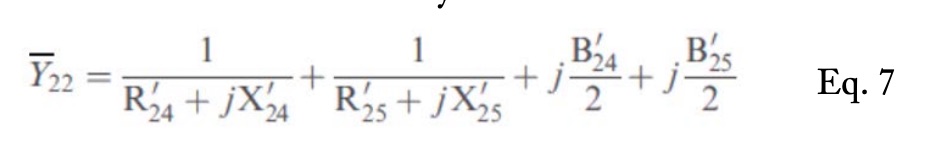
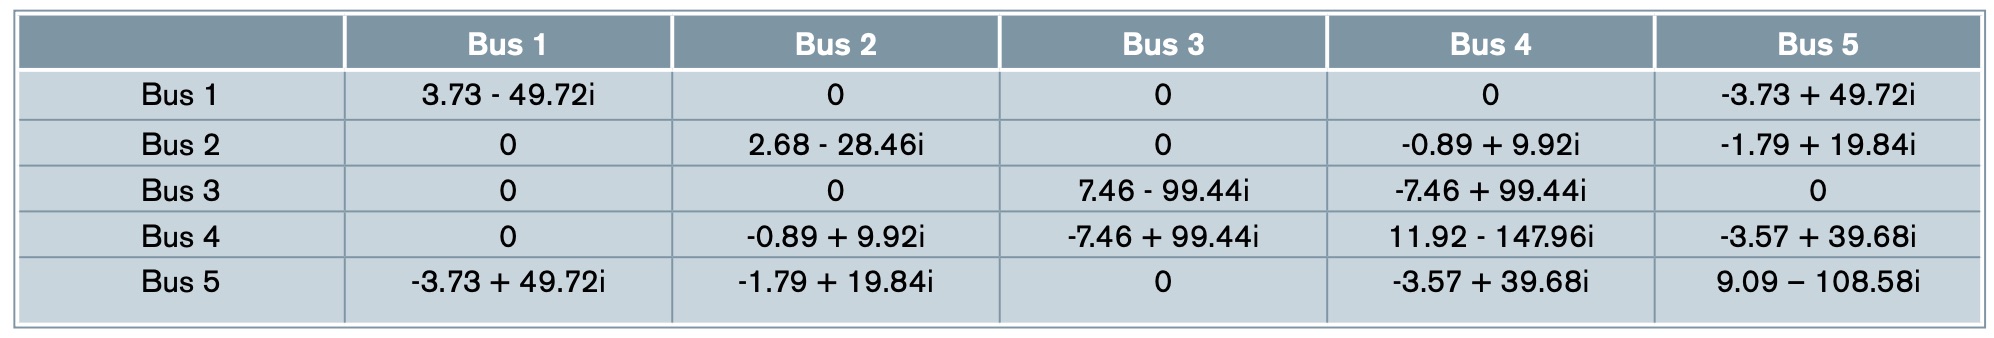
Calculation of the Admittance Matrix [Y]: To calculate the element Y22 Eq. 7. is used. The rest of the diagonal elements are calculated similarly.
 Element Y24 (and Y42 since the matrix is symmetric) is computed using Eq. 8. The rest of the diagonal elements are calculated similarly
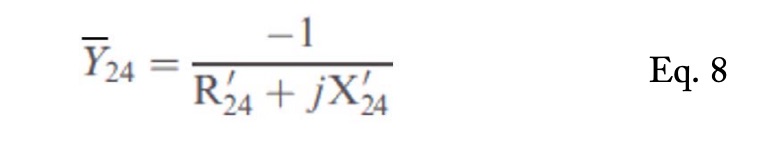 Table 4 shows the admittance matrix with all the calculated elements.
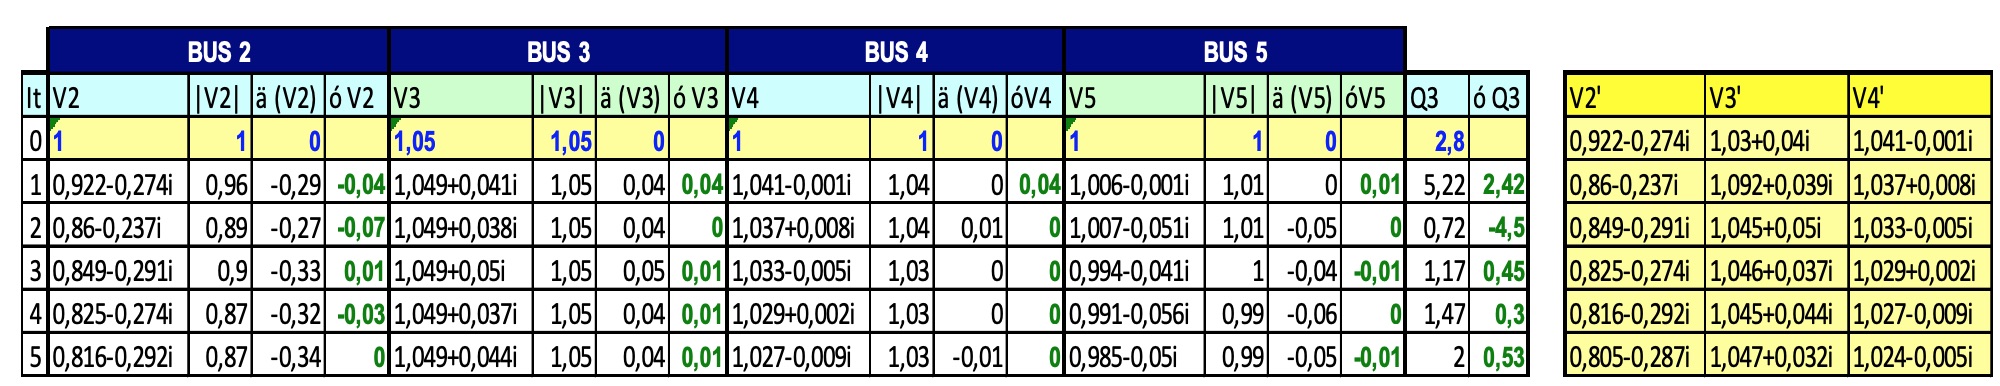
Estimation of the unknowns in all the buses: the voltage is estimated from Eq. 3. Applying Eq. 3 to bus 2, Eq. 9 is obtained as a result.
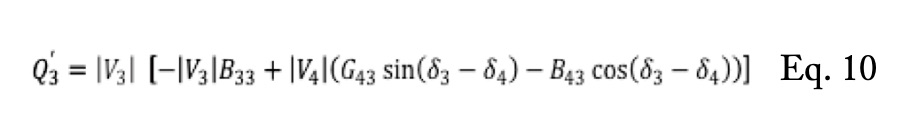
 Similarly, Eq. 4 and Eq. 5 estimate the active and reactive powers. The value of Q3 is calculated applying Eq. 5 to bus 3, obtaining Eq. 10.
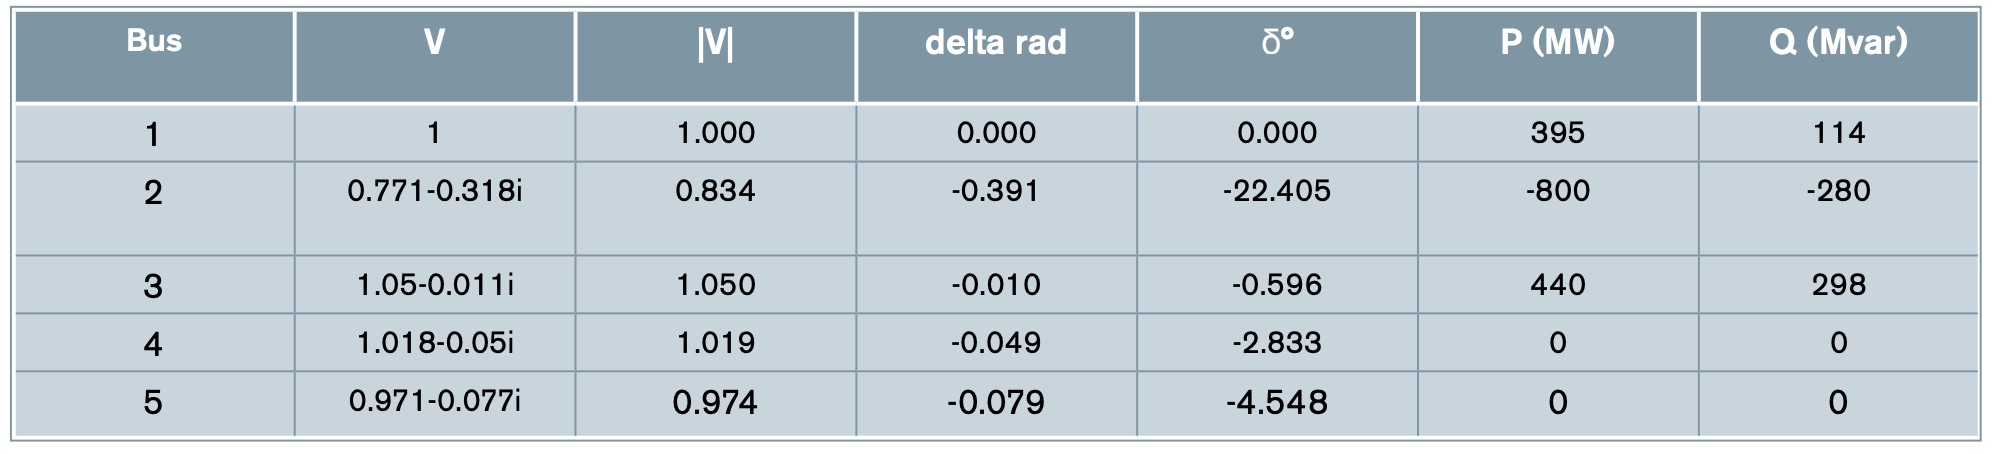
 The results of the first five iterations are shown in Table 5. They give information about the modulus and the argument of voltage and active and reactive power for every bus (Table 6).
The results obtained in Excel are compared with those obtained by software such as the PowerWorld simulator to validate the model. The error obtained in most cases is 0% (taking into account up to the third decimal) and less than 0.1 in all cases.
Conclusions
The specialized software used to estimate load flows has a high economic cost. A low-cost alternative to solve charge flow systems using the Gauss-Seidel method is employing a commonly used tool such as MS Excel. This methodology demonstrates the potential of a tool such as MS Excel to analyze abstract engineering concepts such as power flows by calculating complex numbers. In particular, a power flow problem has been solved, obtaining information on the modulus and the argument of the voltage and the active and reactive powers for all the buses.
p.u.:Vbase is 15kV [buses 1 y 3] and 345 kV [buses 2, 4 and 5].).
From the teaching and educational point of view, the convenience of using tools such as MS Excel for difficult-to-solve applications, such as the one presented here, is justified for several reasons. MS Excel is easy to access for students and teachers, its high degree of implementation at the user level, and the representation of numerical results is simple.
On the other hand, Microsoft EXCEL makes available to users the possibility of carrying out vector, matrix, and complex number calculations, which, despite being an aspect relatively unknown by regular users of this tool, makes it an environment ideal for obtaining practical results in the field of engineering.
References
Alcázar-Ortega, M., & Bel Álvarez, C. (2020). Prácticas de sistemas eléctricos de potencia (Universitat Politècnica de València, Ed.). Valencia (Spain): Universitat Politècnica de València.
Alcazar-Ortega, M., Cañas Peñuelas, C., Escrivá Escrivá, G., Fuster Roig, V., & Roger Folch, J. (2019). Generación, transporte y distribución de energía eléctrica (Universitat Politècnica de València, Ed.). Universitat Politècnica de València.
Alcázar-Ortega, M., Montuori, L., Ribó-Pérez, D., & Álvarez-Bel, C. (2019). Herramientas de visualización en ingeniería eléctrica basadas en Microsoft EXCEL: aplicación práctica al Teorema de Ferraris. 52-66.
Cañas Peñuelas, C., Vargas Salgado, C., Roldán Blay, C., Alcázar Ortega, M., Fuster Roig, V., Benlloch Ramos, V., & Escrivá Escrivá, G. (2020). Prácticas en sistemas de generación , transporte y distribución de energía eléctrica (Universitat Politècnica de València, Ed.). Valencia: Universitat Politècnica de València.
Duncan Glover, J., Sarma, M. S., & Voverbye, T. J. (2011). Power system. Analysis design (S. EDITION, Ed.; Second).
PowerWorld. The visual approach to electric power systems. (n.d.). Retrieved from https://www. powerworld.com/