A study of the corrosion in the equipment of a WWTP for planning preventive measures
Estudio de la corrosión en equipos de una EDAR para la planificación de medidas preventivas
M.D. Sánchez Blanco 1, F.C. Gómez de León Hijes 2, F.J. Navarro Sánchez 3
Abstract
Corrosion keeps being one of the problems that causes huge losses worldwide and, if not properly detected, triggers failures in industrial facilities, with the consequent risk that this entails. Particularly, in wastewater treatment plants (WWTP), corrosion is responsible for significantly reducing the useful life of equipment, pipes, instruments, etc. causing large economic losses and, sometimes, accidents due to the premature degradation of materials in equipment and metal structures. Among the factors causing corrosion are hydrogen sulphide and the humidity inherent to these installations. In this work, the concentrations of these two agents in a WWTP are analysed, representing them through concentration maps, to study their relationship with the elements most affected by this phenomenon, that reveals the areas of the facility that were potentially most exposed to corrosion. Furthermore, because of these results, maintenance strategies were modified, largely reactive, including a program of periodic preventive actions in the facility, prioritized based on the criticality of the equipment, as well as other elements of the facility, and the level of potential exposure to such corrosive agents.
Keywords: Corrosion, hydrogen sulphide, preventive maintenance, WWTP.
Resumen
La corrosión sigue siendo uno de los problemas causantes de enormes pérdidas en todo el mundo y, de no ser adecuadamente detectado, desencadenante de fallos en las instalaciones industriales, con el consiguiente riesgo que esto supone. Particularmente, en las estaciones depuradoras de aguas residuales (EDAR), la corrosión puede reducir significativamente la vida útil de los equipos, tuberías, instrumentos, etc. y causar cuantiosas pérdidas económicas y, en ocasiones, accidentes debido a la degradación prematura de los materiales en equipos y estructuras metálicas. Entre los factores causantes de la corrosión se encuentran el ácido sulfhídrico y la humedad inherente a estas instalaciones. En este trabajo se analizan las concentraciones de estos dos agentes en una EDAR, representándolas mediante mapas de concentración, para estudiar su relación con los elementos más afectados por este fenómeno, lo que pone al descubierto las zonas de la instalación que estaban potencialmente más expuestas a la corrosión. Además, como consecuencia de estos resultados, se modificaron las estrategias de mantenimiento, en gran parte reactivas, incluyendo un programa de actuaciones preventivas periódicas en la instalación, priorizadas en función de la criticidad de los equipos y elementos de la instalación y de su nivel de exposición potencial a dichos agentes corrosivos.
Palabras clave: Corrosión, ácido sulfhídrico, mantenimiento preventivo, EDAR.
Recibido/received: 01/06/2023 Aceptado/accepted: 10/10/2023
1 Technical Service & Development. Dow España.
2 Mechanical Engineering Area. University of Murcia.
3 Leader of Purification and Discharge Control Department. Aguas de Murcia.
Corresponding author: Félix Cesáreo Gómez de León Hijes; e-mail: gd****@**.es
1. Introduction
In industrialized countries, direct and indirect losses due to corrosion are between 3% and 4% of their GDP (García et al., 2015; Gómez de León and Alcaraz, 2004), an even higher figures in developing countries, where protection and preventive measures against corrosion are clearly lower. Furthermore, not a minor problem is the loss of materials, which are discarded without any recovery process (Gómez, 2004). It is estimated that 25% of the annual world production of steel is destroyed due to corrosion (García et al., 2015; Ávila and Genescá, 1995). According to the World Corrosion Organization, between 15% and 35% of annual losses caused by corrosion could be saved if prevention and control actions were implemented (Crespo, 2022).
Particularly, in wastewater treatment plants (WWTP), corrosion is an inherent problem because wastewater constitutes a powerful corrosive and aggressive agent, as do other waste and emissions that arise during the purification process. Whether in liquid, solid or gaseous phase, corrosive processes develop spontaneously, causing considerable maintenance costs, both in repairs and preventive measures, in addition to equipment failures, more specifically in pipes and lines of water and sludge, metal structures and even in warehouses, where electrical panels, instruments, various substances, etc., are temporarily stored.
Consequently, carrying out an exhaustive analysis of the corrosive processes that develop in a wastewater treatment plant is beneficial in several aspects. Firstly, it can suggest relevant conclusions regarding preventive measures, thus facilitating the work regarding maintenance of this type of facilities. At the same time, if situations that promote corrosion are foreseen, the costs related to this phenomenon can be reduced. Finally, given that corrosion can trigger accidents due to material failure, an exhaustive study of its evolution would increase safety in this type of facilities.
For this reason, at the WWTP under study it was decided to carry out an indepth preventive inspection, including absolutely all elements of the plant, in order to check its current state and, consequently, analyse the convenience of modifying the programmed preventive strategies.
This study has been carried out in a large WWTP in the Region of Murcia, which is located on the left bank of the Segura river, downstream from the urban area of the city of Murcia (Spain). It is, due to its purification capacity, the largest wastewater treatment plant in the Region of Murcia and the 18th in Spain (EMUASA, 2023).
The plant under study has a design flow of 100,000 m3/day and serves most of the population of the municipality of Murcia, with a population in 2022 of 462,979 in 2022, according to Spanish National Institute of Statistics (INE, 2022). It is a modern facility, with advanced purification technologies, which has a sludge production of 5,587 tons of dry matter/year that are reused mainly in agriculture. The purified water is returned to Segura river, collaborating in its regeneration and conservation, while the dehydrated sludge has a direct agricultural application and compost production. In addition, the WWTP has a biogas production stage that satisfies 100% of the process heat needs and 48% of the electricity consumption of the WWTP (iAgua, 2012).
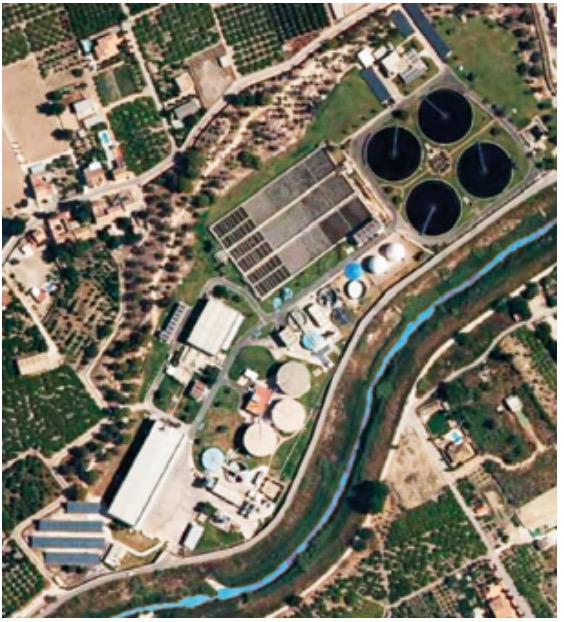
Figure 1 shows an orthophoto of the WWTP, where the distribution of the facilities can be observed as well as Segura river, coloured blue to highlight it, where the treated water is discharged.
The overall process of the plant is divided into three lines (Vicepresidencia, 2023): water line, sludge line and, from 2012, a gas line that provides energy to the plant from the biogas generated during the purification process.
As seen in that image (Figure 1), the facilities extend parallel to the river, having the raw water inlet (pretreatment stage) through the highest area (lower left area of the image) and, by gravity, it passes through the successive stages of the process, with a lower altitude (upper right area of the image), that is, from southwest to northeast, to be discharged into the river once the water has been purified.
2. Methodology
2.1. Corrosive agents
The corrosive processes that develop in a wastewater treatment plant have mainly three origins: electrochemical, chemical and microbial activity. The synergistic effect of these three causes premature degradation in all plant facilities and equipment (Marín et al., 2011). The unforeseen failure of a treatment plant can cause total or partial discharge of wastewater without correctly completing its purification process and, in addition to the economic losses it entails, it would have a high social, health and environmental cost.
Although water itself already produces corrosion in many materials, the organic and inorganic substances present in wastewater, with high quantities of microorganisms capable of producing microbiological or bacterial corrosion (Loto, 2017; Gómez de León and Alcaraz, 2004), enhance its corrosive activity. In addition, there are other factors that trigger corrosive processes that are equally important and that must be considered (INNOTEC, 2021). Thus, according to the sources consulted in the WWTP laboratories under study, important corrosive agents can be found in the waste produced in the different operations, such as: chemicals for cleaning and periodic maintenance, purges in the degreasing and sanding stage, purges in the primary and secondary decantation stages, or in the water from drying or centrifugation of the sludge line. On the other hand, the emissions produced in the different processes are a highly relevant corrosive agent.
The wastewater that enters in a treatment plant contains of a wide variety of volatile compounds, which may be proper of said water, but also coming from chemical and microbial reactions that occur in it. It is worth highlighting hydrogen sulphide (H2S), a gas with a characteristic rotten egg stench that is common in this type of facilities, which easily leaves the liquid phase, forming part of the gas phase and, consequently, of the surrounding atmosphere, coming into contact with all the equipment, pipes, and instruments of the plant, where important corrosive processes will develop.
Other corrosive agents are solids separated whether forcibly or not, as well as deposits that appear in different equipment and lines, mainly in pipes or places with a low slope, manholes and bottoms of bags, areas prone to the accumulation of solids and in which there is a low flow velocity. There is also a considerable risk of finding solid deposits in equipment that is not used frequently and that can fill with waste naturally (rain, infiltrations, etc.) or remain stopped for certain periods of time, such as pipes or pumps. Among the most chemically and biologically aggressive solid waste, it is worth highlighting the solids removed in the coarse matter pit and in tanks before reaching the pumping of raw water, screening of coarse matter and solids removed in the gritting and degreasing process, and sludge from the primary and secondary settling processes.
2.2. Corrosive process caused by H2 S
According to Bethencourt et al. (Bethencourt et al., 2010), “in wastewater the most frequent origin of this volatile gas is the reduction of sulphate carried out by sulphate-reducing bacteria (SRB)”, capable of oxidizing, under anaerobic conditions, organic matter containing sulphur, releasing H2S. In areas with low circulation speed, for instance, in sludge line pipes, bacteria are accumulated, creating biofilms that protect the bacteria from acids, alkalis, oxygen, etc. Furthermore, these biofilms can, on the one hand, also actively participate in corrosive processes through direct interactions with the metal surface and, on the other hand, form differential aeration cells, creating corrosion piles due to different oxygenation in different areas of the metal surface.
Under humid and warm conditions, hydrogen sulphide can undergo biological oxidation forming sulfuric acid, which is the main corrosive agent in facilities. The reactions that rule these processes are indicated below (Tchobanoglous and Burton, 1998):
FORMULA
H2 SO4 attacks concrete, copper, steel, iron, etc., prematurely degrading those structures where preventive measures have not been adopted. Corrosion rate increases with H2S concentration, humidity, temperature and the number of bacteria. Corrosive power increases when the structures are submerged.
2.3. Importance of humidity in the environment
One of the factors that enhances the phenomenon of corrosion in the atmospheric medium is the amount of water contained in the air, that is, the relative humidity of the surrounding atmosphere which, given the nature of a WWTP, is always present at high values. Humidity is considered the most damaging atmospheric agent with respect to corrosion.
In these cases, the corrosion mechanism is of electrochemical origin, whose electrolyte is the layer of humidity on the surface of the metal. The intensity of the corrosive process will depend on the length of time the humidity layer remains on the metal, as well as the thickness of said layer. The smaller the thickness of the humidity layer, the greater the ohmic resistance between the anode (metal) and the cathode, making it more difficult for corrosion to advance (Genescá, 1994).
Therefore, it can be stated that one of the main causes of corrosion in a WWTP comes from hydrogen sulphide, present in these facilities, in combination with high relative humidity.
3. Methodology and results
3.1. Functional criticality
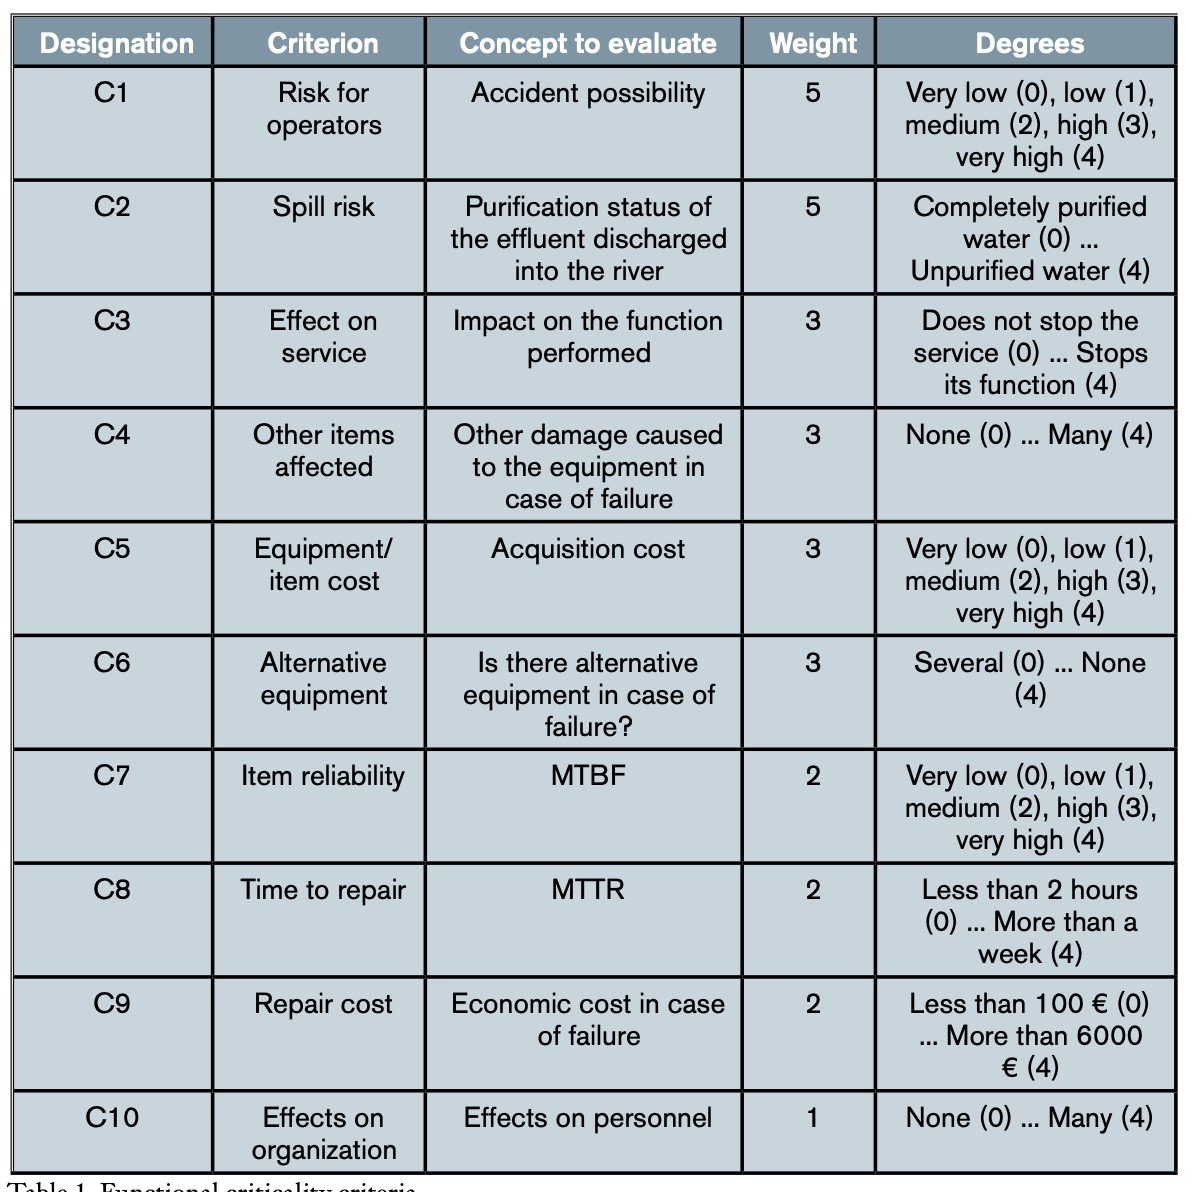
Although all components of the plant, that is, equipment and facilities, are necessary for its operation, not all of them are equally important, in the sense that failure in the service of each of them does not have the same consequences. Therefore, it is convenient, if not necessary from the point of view of maintenance planning, to determine the functional criticality of each element of the installation. Thus, for example, while a total failure in the raw water pumping system would paralyze the process and, consequently, all the incoming water would be poured directly into the river without purification, the failure of one of the pumps in said system would not, since there are redundant pumps. The repair time or the costs derived from the failure are also factors to take into account, since in some stages of the process there is a certain margin of time to stop it, without affecting the general debugging process. To know the functional criticality of each element of the installation, the MCCE (Multi-Criteria Classification of Critical Equipment) method, formulated by Gómez de León and Ruiz (Gómez de León and Ruiz, 2006), was followed. This method provides a percentage scale of relative importance of the elements under study, which is based on the interrelationships of multiple factors that determine the effects of the failure, considering them all together but taking into account their distinct levels of importance and, therefore, of influence on the final result. In order to determine the criticality criteria to be taken into account in the consequences of the failure, as well as their relative importance, that is, the weight (wi) and the different degrees (di) in which each criterion will be evaluated, a team of experts was formed consisting of the following people: the director of the WWTP, the chief maintenance engineer, the two maintenance shift leaders, the process director and the two plant process shift leaders. This team also had the advice of the authors of this work, with voice but no vote in the decisions made.
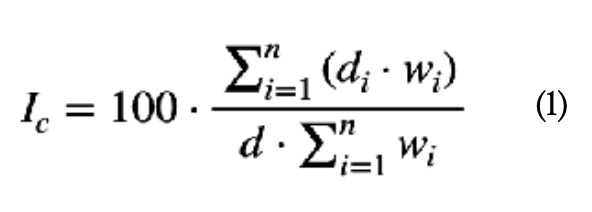
Although table 1 does not show it in detail, it can be seen that each of the ten criteria (n = 10) is divided into five levels or degrees of criticality (di), each of which represents the extent to which the failure of the element analysed has importance as far as the criterion in question is concerned. Following the method presented (Gómez de León y Ruiz, 2006), the criticality index (Ic) of each element is calculated by applying equation (1), where d is the maximum value that can be reached with a criterion. As seen in table 1, in this case d = 4: (1)
 The result of applying this method to all the analysed elements of the WWTP results in an ordered list of all of them according to their criticality index, that is, the relative importance that the consequences derived from the possible failure of each element would have for the plant.
3.2. Measurement of H2S concentration and relative humidity
To carry out this analysis, numerous measurements of relative humidity and hydrogen sulfide concentration were made throughout the plant. To do this, firstly, gridded templates were designed on the WWTP plans. In these templates, the measurement points were identified and marked, with planimetry coordinates, in order to later transfer them to the terrain with the greatest possible precision. The purpose of creating those grid templates is to ensure that they were measured uniformly in the surroundings and inside the buildings, to obtain relative humidity and H2S concentration data from the entire WWTP so that they were uniformly distributed and with the greatest repeatability possible.
To facilitate successive measurements, once the templates were finished, the selected measurement points were marked on the floor of the plant. Specifically, outdoors with a grid cell dimension of approximately 3 × 5 meters and indoors with a grid cell dimension of approximately 2 × 2 meters. The stages and buildings considered were pretreatment, primary decantation, biological reactor, secondary decantation, control building and sludge line.
To mark the grid points on the floor, a fluorine red spray was used so that the marks could be seen long enough (approximately six months) to take measurements. Once the study was completed, all marks were removed. In total, 476 points were scored outdoors and 452 indoors.
The instrument used to measure hydrogen sulphide (H2S) concentrations was the Jerome J605 Hydrogen Sulphide Analyzer. This equipment allows measuring concentrations in a range of 3 parts per billion (3 ppb; 0.003 ppm) to 10 parts per million (10 ppm). Values greater than 10 ppm are displayed as high concentration, while values less than 3 ppb are displayed as 0.00 ppb. This is because NIOSH (National Institute for Occupational Safety and Health), part of the United States Health Service, recommends not exceeding the maximum exposure limit of 10 ppm over a 10-minute period. Nevertheless, low concentrations, up to 20 ppm, can cause nose and throat irritation. At high concentrations (generally greater than 500 ppm) it can cause loss of consciousness and even death even in very short periods of time, even less than a minute.
The instrument used to determine relative humidity is the PCE-313S Thermohygrometer, which is capable of measuring relative humidity in a range of 10-95%, with a resolution of 0.1%, and temperatures from 0 to 50 °C with a resolution of 0.1 °C.


3.3. Measurement maps
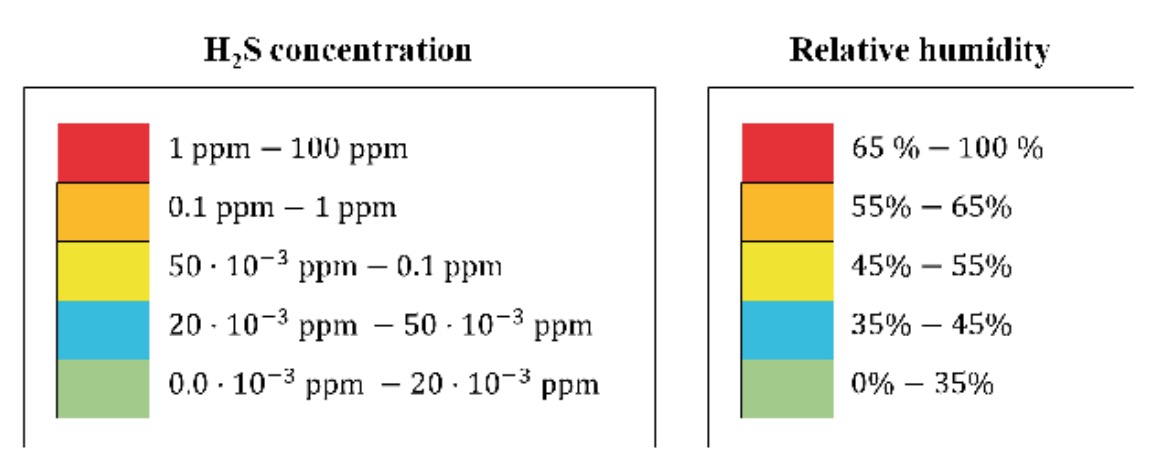
The results of the H2S concentration and relative humidity measurements carried out have been represented in the form of contour lines, with coloured areas, on the WWTP plans. The colour correspondence of each zone, according to its concentration of H2S or humidity, respectively, is shown in figure 2.
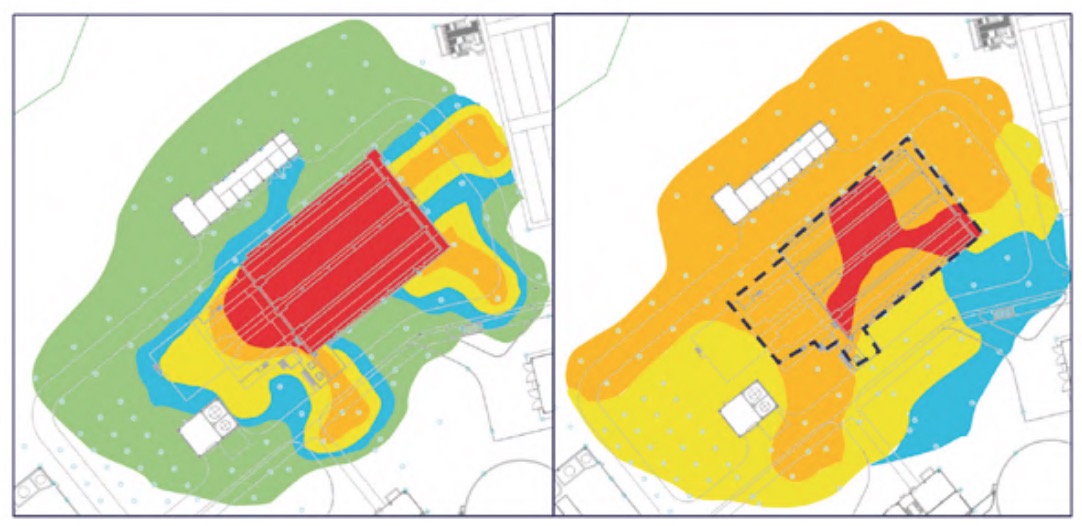
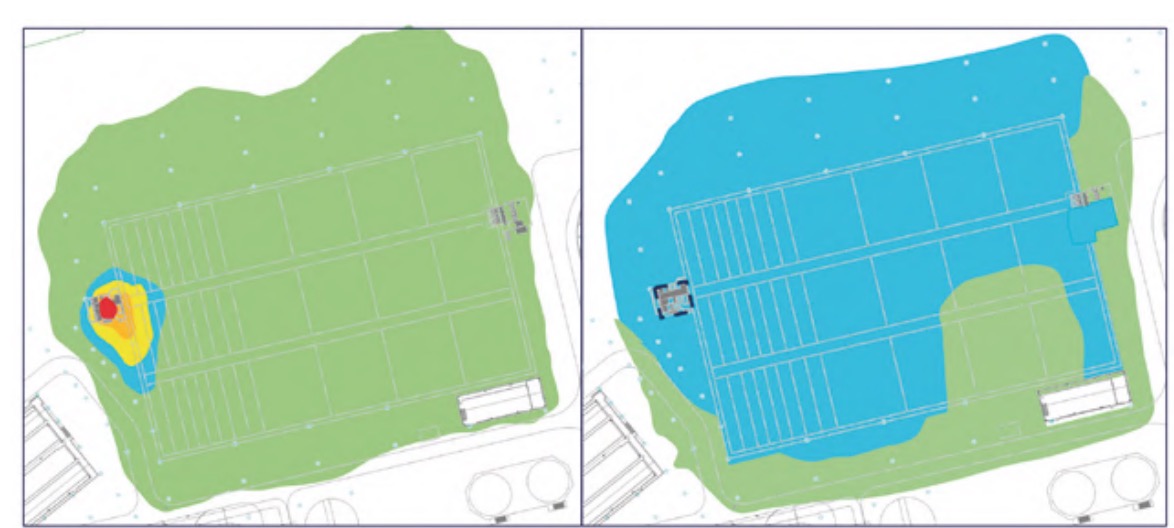
It should be noted that measurements were also made in other buildings and areas of the plant, but the H2S concentrations were practically zero and, in addition, the relative humidity values were clearly lower than those analysed, specifically, the pretreatment buildings (Figure 3), lamellar decantation building (Figure 4), the sludge line (Figure 5) and the biological reactor (Figure 6).
3.4. Assessment of the level of exposure to corrosion
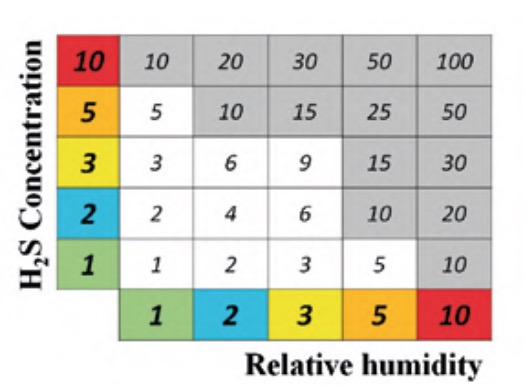
The maps of H2S concentration and relative humidity were superimposed to obtain the areas in which both levels were high and, also, if any equipment or element was susceptible to being affected by corrosion. For example, outdoors where there was no equipment or structure were ruled out. The criterion followed to determine these critical zones was highlighted in figure 7.
Given that the scale of levels of each of the two parameters in question consists of five categories, a relative weight was given to each of them, so that the lowest level was given unit weight and the highest level 10, according to the following sequence of weights: 1, 2, 3, 5 and 10, as indicated in the corresponding cells of each of the parameters in figure 7. As seen in said figure, to evaluate the severity of the conditions that promote corrosion, the Corrosion Exposure Levels matrix is used. It is a criticality matrix calculated following a simple geometric method (Gómez de León et al., 2023), where each cell of the matrix takes the value of the product of the corresponding parameters.
The cut-off level to select the most exposed areas was set at a value of 10. This choice was not arbitrary. On the contrary, after a thorough analysis of the status of corrosion of the equipment and elements of the plant, that is, its degree of affectation, it was possible to demonstrate that the criterion followed was correct. That is, all those areas affected by a clearly higher degree of corrosion had a criticality level greater than 10.
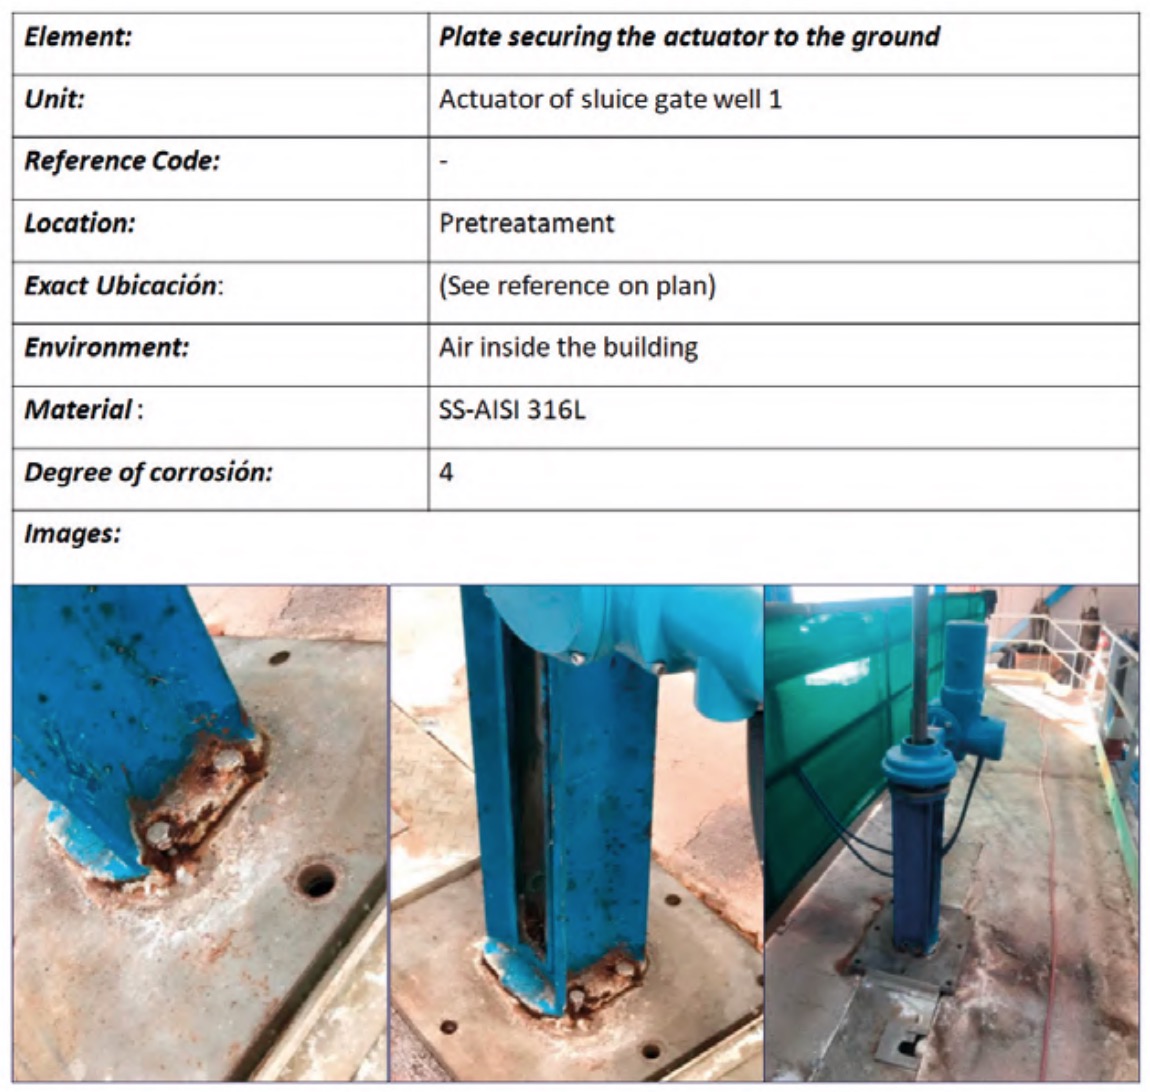
To do this, a status sheet, or registration file, was completed for each of the plant elements where, in addition to the identification and location data of the element, its degree of deterioration due to corrosion was assessed. In all these inspection routes, appropriate protection measures were adopted in each space of the plant (INSST, 2017). Figure 8 shows an example of a register file for one of the elements.
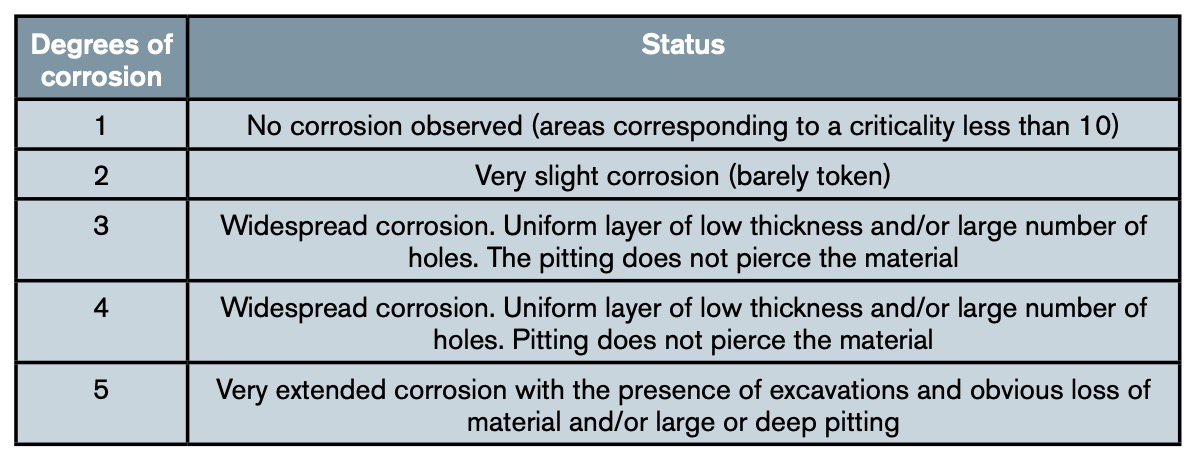
Since the cases were varied, it was decided to establish a classification with the five categories indicated in table 2, so that they sufficiently reflect the different degrees of corrosion damage observed.
It was found that none of the areas of the matrix of figure 7 with an exposure level less than 10 presented elements with a corrosion degree equal to or greater than 3. Consequently, maintenance intensification efforts should focus on the shaded areas of said matrix.
Although, as expected, an area with an exposure level of 100 indicates a maximum exposure to the corrosive phenomenon potentially ten times greater than that of another with a value of 10, it is also necessary to consider the risk associated with potential failure of each of the affected components. In this way, the greater the consequences of the failure of an element, the greater the level of supervision must be or the preventive measures to be carried out, which has been called Functional criticality of the element.
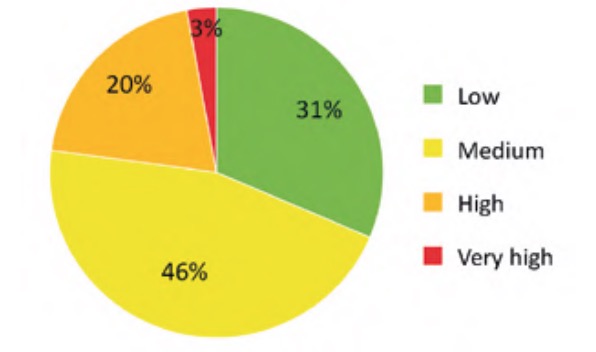
The result of applying the criticality analysis to all the analysed elements of the WWTP resulted in an ordered list of these according to the value of their criticality index. Specifically, in the case studied the values were finally between a minimum value of 5.77% and a maximum of 63.38%. To simplify the interpretation and subsequent use of these results, the indicated range was divided into four approximately equal parts (classes) whose criticality indices were considered: low (Ic ?20%), medium (20%50%). The number of elements of each of the classes of this partition is represented in percentage terms in figure 9, for the water line elements, and in figure 10, for the sludge line elements.
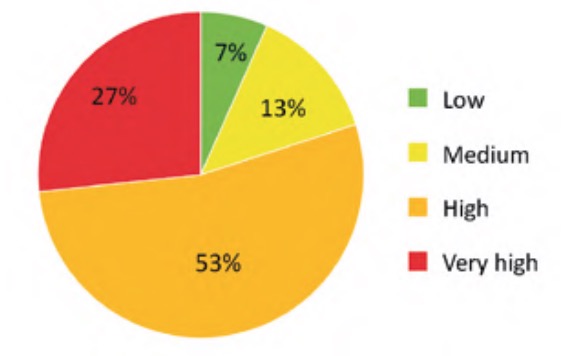
according to their criticality index.
according to their criticality index.
3.5. Combined effect of functional criticality and corrosion exposure
As shown in table 2, the criteria evaluated to determine the functional criticality of each of the plant elements only take into consideration their effect on the service, but not the level of exposure to corrosion and, consequently, the risk associated with said exposure. The combined effect of both factors will be obtained by applying the same MCCE methodology, previously used to calculate functional criticality, giving the same weight to both factors.
Since both factors move on a scale from 0 to 100 (figure 7 and equation 1), the effect of both factors, or combined criticality, is obtained as a semisum of both values, resulting in the distribution of values shown in figure 11. It is, therefore, an aggregative method with identical weights for both factors (Gómez de León et al., 2023), where the combined criticality takes values between 0 and 100, which is easily interpretable in relative terms.
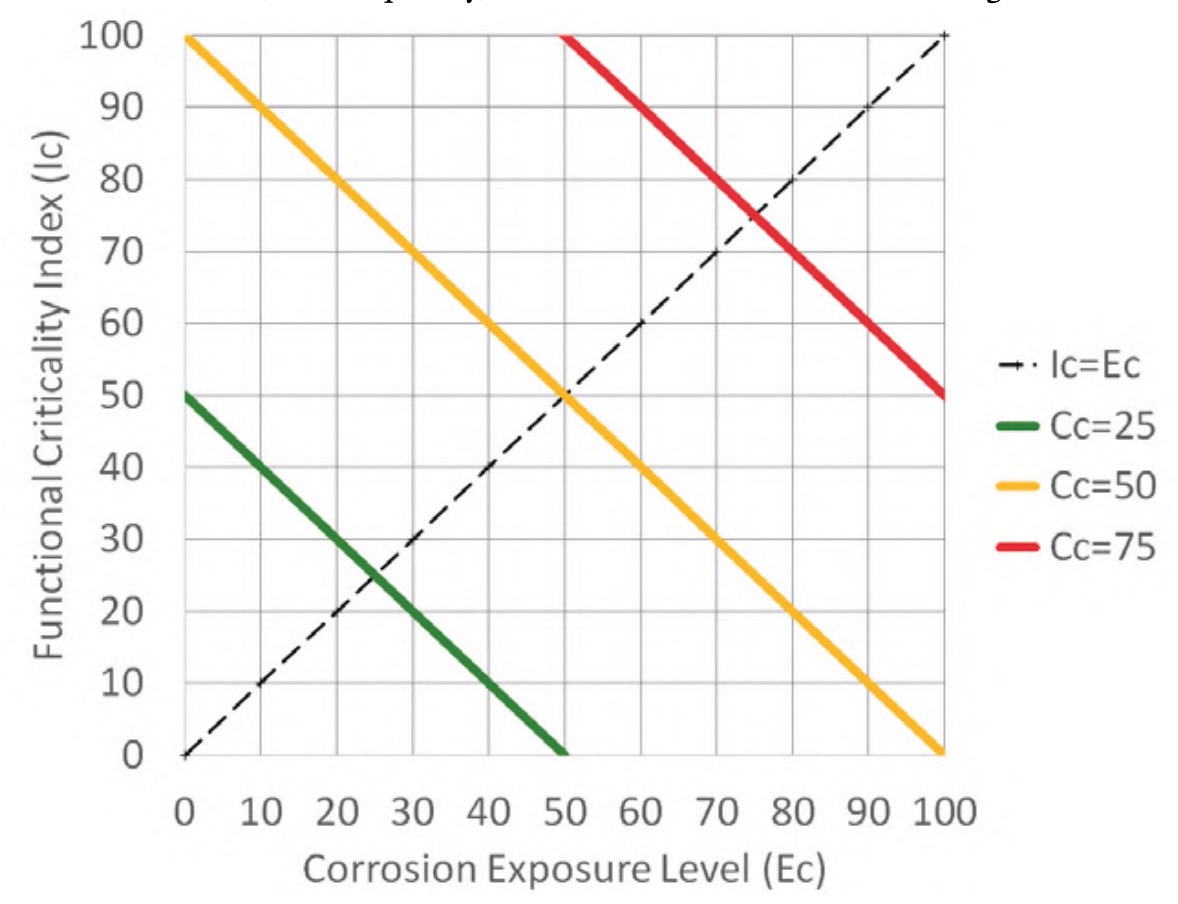
Figure 11 shows three lines corresponding to the points on the graph whose combined criticality (Cc) has a value of 25 (green line), 50 (orange line) and 75 (red line). These three lines delimit four areas that make it easier to group the elements of the installation into blocks to set preventive routines with different periodicities to be applied to each of the elements of the installation depending on its combined criticality.
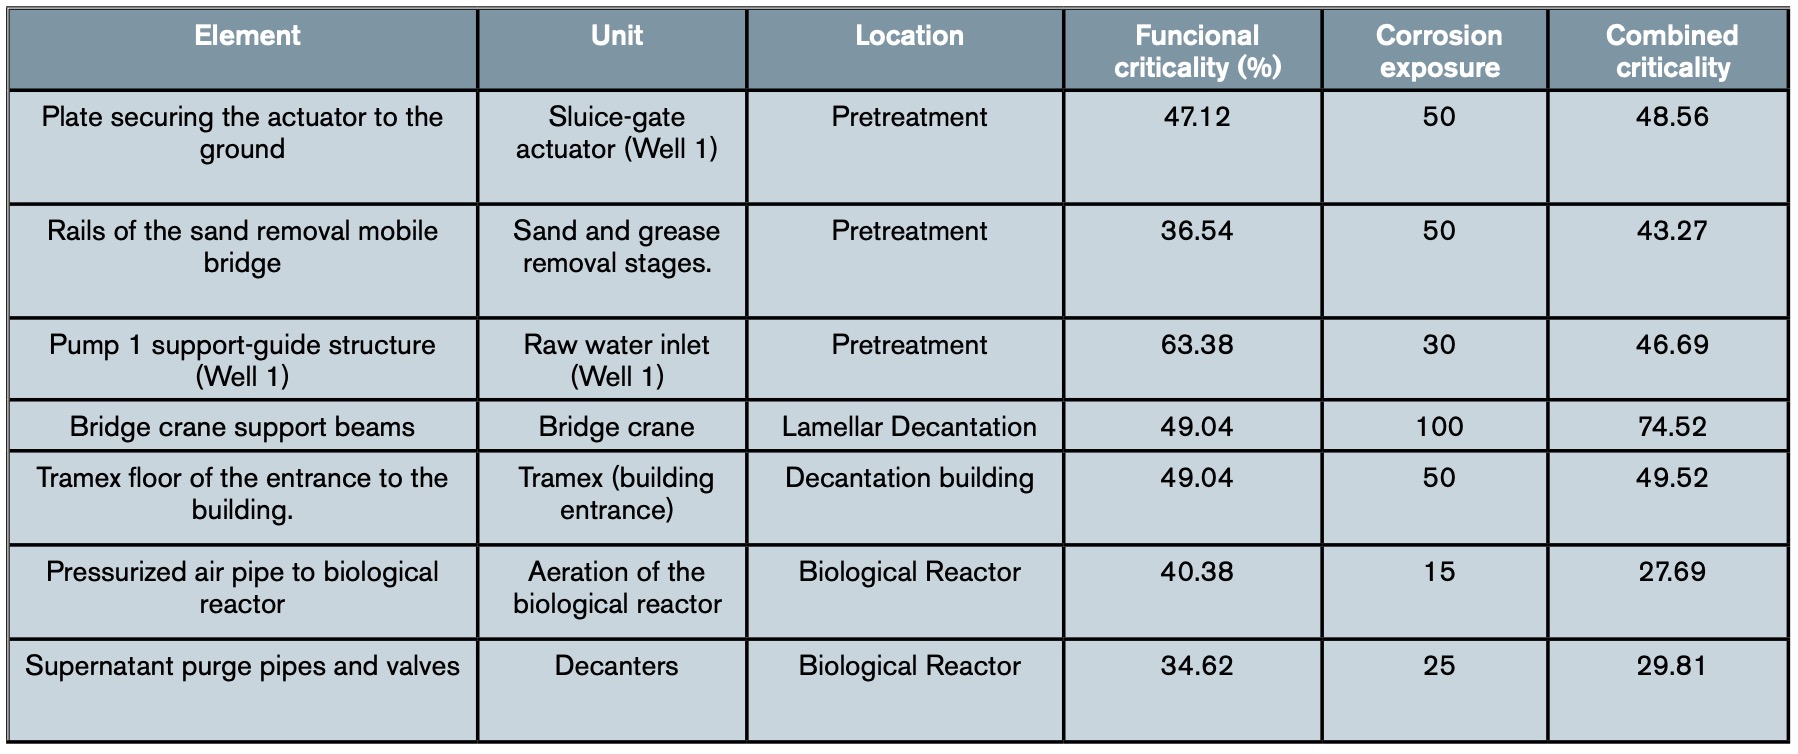
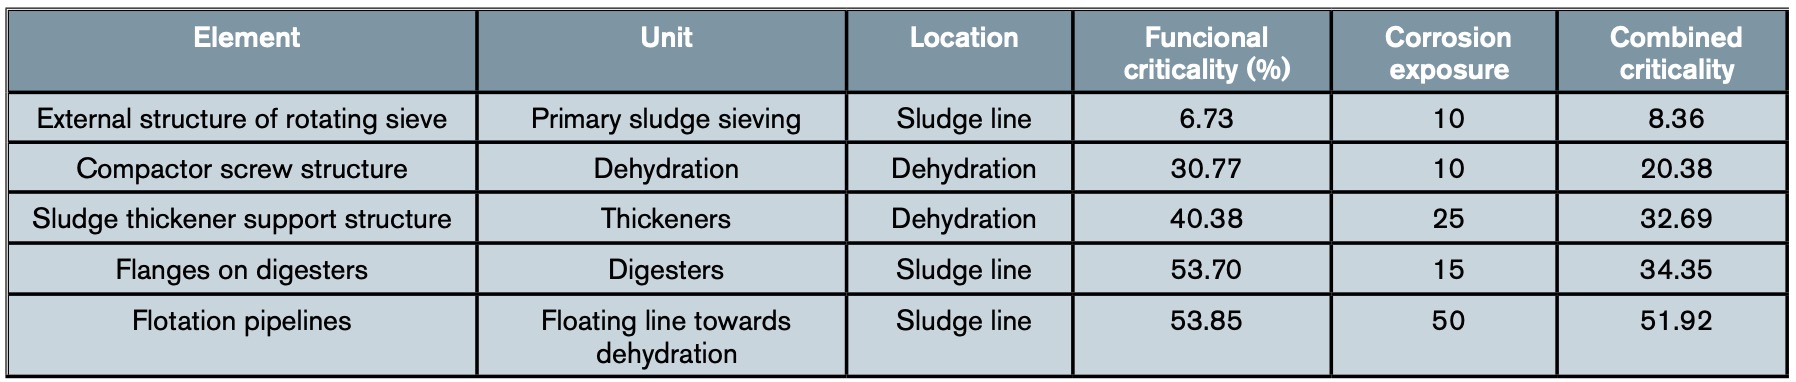
Table 3 shows an example of the results obtained in some elements of the water line after applying the complete methodology set out in the WWTP, while table 4 shows an example with the combined criticality obtained for some elements of the sludge line.
4. Discussion: Planning preventive measures
Although a predictive maintenance plan is followed in the WWTP under study, it applies only to dynamic equipment: motors, pumps, fans, blowers, compressors, etc., plant components whose operation is essential to carry out the entire purification process. Due to the nature of its function, its rate of deterioration, that is, its frequency of failure, is clearly higher than that of the static elements or equipment of the installation, such as pipes, supports, flanges, metal structures, etc. In addition, periodic preventive maintenance reviews are carried out at the plant. It was precisely as a result of these reviews that the advanced state of deterioration due to corrosion of some parts of the plant was detected, as well as the dispersion of its effects, which launched and formed the work team described in section 6 and the project of the work summarized here.
The results of the study carried out were useful not only to determine the criticality of the equipment, from the point of view of risk to the effects of corrosion, but also made it possible to analyse in detail the status of the entire plant, as well as reveal the convenience of carrying out certain corrective maintenance actions in some of the elements of the plant.
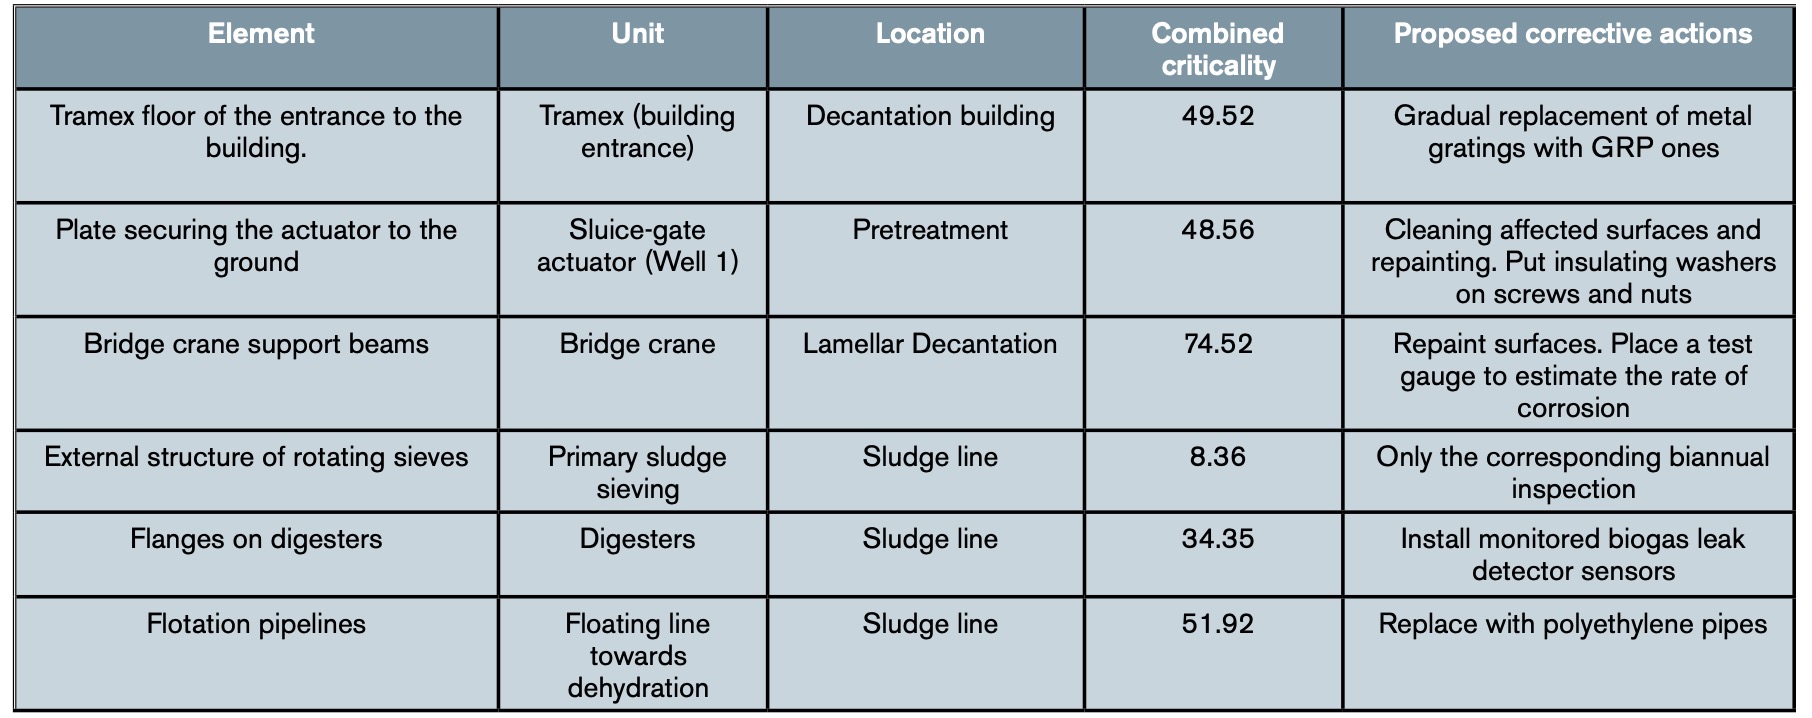
The result was a table with all the specific actions to be carried out on the affected elements of the plant. Table 5 shows, as an illustrative example, the actions to be carried out on some of the elements shown in tables 3 and 4. In addition, the work team agreed to include, within its catalogue of Preventive Work Orders of the plant, periodic reviews of these elements to evaluate their status and evolution, that is, their degree of affectation by corrosion. While waiting to observe the results of the first reviews, it was decided to schedule them on an annual basis for all those elements that had obtained a combined criticality greater than 50 and on a biannual basis for those that had a lower criticality.
5. Conclusions
Corrosion in the equipment and facilities of a wastewater treatment plant (WWTP) constitutes a severe problem that causes enormous losses. It represents a danger to the environment if an uncontrolled discharge of wastewater occurs due to the failure of essential elements of the purification process and, even more serious, it can cause unforeseen accidents due to “apparently” sudden breaks.
Therefore, determining the causes of corrosive processes in the plant is the first step to implement preventive measures that minimize their impact and reduce the possibility of unforeseen breakdowns and accidents to the minimum possible. As demonstrated by the study carried out in a WWTP, given the nature of its operation, the agents that most contribute to triggering the corrosive phenomenon are water, with the consequent high level of humidity in the plant, and high concentrations of hydrogen sulphide, H2S, whose joint effect generates sulfuric acid as a product, a highly aggressive substance that deteriorates equipment, structures and facilities at high speed.
Using concentration maps of both agents throughout the plant, and their subsequent superimposition, an assessment of the level of exposure to corrosion in each area of the plant can be obtained. A discrete scale of values ranging from 0 to 100 has been used, which represent the two extreme situations, that is, a negligible exposure level and the maximum exposure level of the plant, respectively. In this way, it is possible to know which parts, equipment and structures of the plant are most exposed to corrosive phenomena. To establish a plan of preventive measures against maintenance, given that the resources allocated to maintenance are always limited, the above information was combined with the criticality of each of the equipment and elements of the plant. In this way, the most urgent measures, as well as the most far-reaching, can be concentrated on the most critical equipment, the failure of which would have the worst consequences for people, the environment and the economic consequences for the plant. To classify the equipment according to its functional criticality, the MCCE (Multi-Criteria Classification of Critical Equipment) method has been used.
The joint evaluation of the functional criticality of the equipment together with its level of exposure to corrosion results in a percentage value of combined criticality for each of the equipment and elements under analysis, which facilitates decision making when establish periodic preventive maintenance programs, as well as priorities when adopting corrective measures in each of them.
References
Ávila Mendoza J, Genescá J (1995). La corrosión en la vida diaria. Más allá de la herrumbre (I). Instituto Latinoamericano de la Comunicación Educativa. Biblioteca Digital. La ciencia para todos. México. Available in: http:// bibliotecadigital.ilce.edu.mx/sites/ ciencia/volumen1/ciencia2/09/htm/ sec_6.html (Consulted April 4 2023).
Bethencourt M, García de Lomas J, Corzo A, Villahermosa D, Matres V (2010). Efecto de la biopelícula en la corrosión de aceros inoxidables. Revista de metalurgia, 46(1): 37-51.
Crespo J (2022). El problema de la corrosión y su implicancia en pérdidas económicas para la industria. Available in: https://www. linkedin.com/pulse/el-problemade-la-corrosi%C3%B3n-y-suimplicancia-en-p%C3%A9rdidas– 1e/ (Consulted April 14 2023).
EMUASA (2023). Aguas de Murcia. Available in: https://www.emuasa. es/depuracion (Consulted April 14 2023).
García-Delgado BM, Corvo-Pérez FE, Moo-Yam VM (2015). Generación de conocimiento para la medición continua y a distancia de la corrosión. Uso de la información de patentes. Revista CENIC. Ciencias Químicas, 46: 152-160.
Genescá Llongueras J (1994). Más allá de la herrumbre, III. Corrosión y medio ambiente. Fondo de Cultura Económica (FCE). México.
Gómez de León Hijes FC, Alcaraz Lorente D (2004). Manual básico de corrosión para ingenieros. Servicio de publicaciones de la Universidad de Murcia, Murcia. ISBN 84-8371- 506-6.
Gómez de León Hijes FC, Ruiz Cartagena JJ (2006). Maintenance strategy based on a multicriterion classification of equipments. Reliability Engineering & System Safety, 91(4): 444-451.
Gómez de León FC, Sánchez Robles J, Martínez García FM, Alarcón García M (2023). Dynamic management of periodicity between measurements in predictive maintenance. Measurement 213: 112721.
Gómez Fernández JC (2004). El problema de la corrosión. Academia de Ciencias de la Región de Murcia (um.es). Available in: https://www. um.es/acc/el-problema-de-lacorrosion/ (Consulted April 14 2023).
iAgua (2012). Smart Water Magazine. Available in: https://www.iagua.es/ data/infraestructuras/edar/murciaeste (Consulted April 14 2023).
INE (2022). Población del municipio de Murcia. Available in: https://www. ine.es/jaxiT3/Datos.htm?t=2883 (Consultado el 14 de abril de 2023).
INNOTEC Laboratorios (2021). La importancia y características de las aguas residuales. 17 de junio de 2021. Available in: https:// www.innotec-laboratorios.es/laimportancia-y-caracteristicas-delas-aguas-residuales/ (Consulted April 14 2023).
INSST. Instituto Nacional de Seguridad y Salud en el Trabajo (2017). Documento 024. Limpieza y mantenimiento en espacios confinados de estaciones depuradoras de aguas residuales: exposición a sulfuro de hidrógeno. Available in: https://www.insst. es/stp/basequim/024-limpiezay-mantenimiento-en-espaciosconfinados-de-estacionesdepuradoras-de-aguas-residualesexposicion-a-sulfuro-dehidrogeno-2017 (Consulted March 15 2023).
Loto CA (2017). Microbiological corrosion: mechanism, control and impact—a review. The International Journal of Advanced Manufacturing Technology, Springer 92(9-12): 4241-4252.
Marín Galvín R (2011). Corrosión y agresividad en aguas residuales. Mecanismos, ejemplos y costes.
Tecno ambiente: Revista profesional de tecnología y equipamiento de ingeniería ambiental, 21(219): 15- 24. Tchobanoglous G, Burton FL (1998). Ingeniería de aguas residuales: tratamiento, vertido y reutilización. McGraw-Hill. Madrid.
Vicepresidencia tercera del Gobierno. Ministerio para la Transición Ecológica y el reto demográfico (2023). Anteproyecto, estudio de impacto ambiental y seguimiento y gestión de la evaluación de impacto ambiental que corresponda de las obras de ampliación de la EDAR Murcia-Este. Available in: https:// www.miteco.gob.es/es/agua/ temas/saneamiento-depuracion/ actuaciones/Murcia%20Este.aspx (Consulted April 14 2023).