
Continuous fatigue monitoring in rotating beams using 3D Digital Image Correlation
Monitorización continua de la evolución de la fatiga en flexión rotatoria mediante correlación digital de imágenes 3D
C. Huertas-Charriel (1), A. García-Martínez (2), L. Felipe-Sesé (1), A. J. Molina-Viedma (1), J. A. Almazán-Lázaro (1), E. López-Alba (3) and F. A. Díaz (3)
Resumen
El análisis de fatiga en viga rotatoria resulta crítico debido al riesgo de fallo catastrófico común en maquinaria con componentes rotatorios. Dichos fallos no solo comprometen la eficiencia operativa, sino que también plantean riesgos de seguridad significativos, lo que ha impulsado una extensa investigación en este campo. Recientemente, las técnicas ópticas han surgido como herramientas valiosas para el análisis estático y dinámico de componentes mecánicos. En concreto, la correlación digital de imágenes 3D (DIC3D) ofrece un enfoque de campo completo con gran potencial para la medición de mapas de desplazamiento y deformación. A diferencia de los sensores de contacto convencionales, que requieren conexiones físicas y solo proporcionan datos discretos (esporádicos), DIC-3D permite realizar mediciones cuantitativas precisas y sin contacto, sin interferir en la operación del sistema. Este trabajo presenta una configuración experimental novedosa para monitorizar de forma continua la evolución de la fatiga en una viga rotatoria, sin necesidad de detener ni ralentizar el ensayo. El método emplea un sistema de cámaras estereoscópicas de alta resolución sincronizado con la rotación de la probeta. Este enfoque elimina la necesidad de costosas cámaras de alta velocidad a la vez que mejora la resolución de la imagen. Mediante el procesamiento de las imágenes con un sistema DIC-3D, ha sido posible obtener series de mapas de desplazamiento y deformación que permiten rastrear el crecimiento de la grieta a lo largo de los ciclos. Los resultados demuestran el potencial de este método para dilucidar el comportamiento de la grieta y predecir la vida útil de componentes críticos en industrias como la energía eólica, la automoción, el sector ferroviario y el aeroespacial. Este método podría abrir una línea interesante para futuras investigaciones.
Palabras clave: Fatiga de materiales, flexión rotativa, correlación digital de imágenes, abertura de grieta y monitorización de la integración estructural.
Abstract
Fatigue analysis in rotating bending is critical due to the risk of catastrophic failure in rotating machinery. Such failures not only compromise operational efficiency, but also pose significant safety hazards, driving extensive research in this field. Recently, optical techniques have emerged as valuable tools for static and dynamic analysis of machine components. Specifically, 3D Digital Image Correlation (3D DIC) offers a robust, full-field approach to measure displacement and strain maps. Unlike conventional contact sensors, which rely on physical connections and yield only discrete data points, 3D DIC provides precise, non-contact quantitative measurements without interfering with the system’s operation. This work presents a novel experimental setup to continuously monitor fatigue evolution in a rotating beam without interrupting the test. The method utilizes a high-resolution stereoscopic camera system synchronized with the specimen’s rotation. This approach eliminates the need for expensive high-speed cameras while improving image resolution. By processing the images via 3D DIC, it is possible to obtain displacement and strain maps that enable the tracking of crack growth throughout the cycles. The results demonstrate the potential of this method to elucidate crack behaviour and predict the service life of critical components in industries such as wind energy, automotive, railway, and aerospace, establishing a solid methodology for future research.
Keywords: Materials fatigue, rotating beam, digital image correlation, crack opening, and monitoring of structural integration.
Recibido/received: 03/07/2025
Aceptado/accepted: 05/02/2026
1 Department of Mechanical and Mining Engineering, EPS Linares, Universidad de Jaén, Spain.
2 CAF Digital Manufacturing, Linares.
3 Department of Mechanical and Mining Engineering, EPS Jaén, Universidad de Jaén, Spain.
Corresponding author: Luis Felipe Sesé; e-mail: lf*****@***en.es
1. INTRODUCTION
Fatigue is a phenomenon that occurs in materials when they are subjected to repeated cyclic loads, which can lead to the initiation of cracks and, ultimately, component failure even when the applied stresses are below the material’s yield strength (R. Budynas & Nisbett, 2020; Lee et al., 2004a). Fatigue is a critical factor in the design of mechanical components, especially those subjected to dynamic loads, such as vibrating components or rotating shafts (Campbell & , 2022; Chandan & Vikas, 2009; Kepka et al., 2024; Smith & Hillmansen, 2004; Tridello et al., 2025). Thus, considering that microscopic cracks will always exist in a material — typically generated in areas with stress concentrators, material defects or manufacturing imperfections— these cracks grow and coalesce with each applied load cycle. This process causes further stress concentration and a reduction in the load-bearing crosssection, among other effects, leading to sudden failure (Suresh, 1998). Therefore, it is crucial to minimize stress concentrators during the design of mechanical elements and to pay special attention to the manufacturing process and surface finish, avoiding both external and internal discontinuities or irregularities (Oberreiter et al., 2023). To evaluate or estimate this life, different methods are used.
However, the most common in industry is the stress-life method. The stress-life method, or S-N approach, is a traditional yet widely used technique for fatigue analysis (Budynas & Nisbett, 2017; Lee et al., 2004; Tridello et al., 2022). This method relies on the experimental generation of an S-N curve, which characterizes the relationship between applied stress amplitude (S) and the number of cycles to failure (N). Historically, the foundational experiment for this method is the rotating beam test (International Organization for Standardization, 2021). In this configuration, a specimen is subjected to a constant bending moment while rotating around its longitudinal axis. Consequently, with each rotation, every point on the specimen’s surface undergoes a complete cycle of fully reversed stress. This setup is particularly valued for assessing the fatigue resistance of shafts and similar components, as it accurately replicates the loading conditions encountered in real-world applications (Carpinteri et al., 2000; DE Freitas & François, 1995; Rastogi & Kumar, 2009). By repeating these tests at various stress levels, the material’s fatigue life is determined (International Organization for Standardization, 2021).
However, it is crucial to note that these results often exhibit considerable scatter due to microstructural heterogeneities, defects, and variations in testing conditions (Lee et al., 2004a). In standard rotating beam tests, instrumentation is typically limited to controlling the precision of the applied bending moment, verified through dimensional measurements or strain gauges (International Organization for Standardization, 2021). Consequently, continuous monitoring of the fatigue damage evolution during the test remains a significant challenge. However, optical techniques like Digital Image Correlation (DIC) have become essential in experimental mechanics for their ability to provide non-contact, fullfield measurements (Niezrecki et al., 2018; M. A. Sutton et al., 2009b). DIC is an optical technique that allows for the measurement of displacements and strains maps on a component’s surface by analysing digital images, so there is measurement. Thus, this technique has great potential for both static and dynamic scientific and industrial applications (He et al., 2024; Molina-Viedma et al, 2018a; Molina-Viedma et al., 2018b; Palanca et al., 2016; Pan, 2011).
In fact, DIC has also been used in advanced studies of fatigue phenomenon. It has been applied for the characterization of crack tip !elds, enabling the calculation of stress intensity factors (SIF), the evaluation of crack closure, and the continuous monitoring of crack propagation rates (Vanlanduit et al., 2009). This technique has been extensively applied across diverse regimes, including low cycle fatigue (LCF), very high cycle fatigue (VHCF), and specialized studies such as fretting and corrosion fatigue (He et al., 2024; Hebert & Khonsari, 2023). Furthermore, its inherent multiscale adaptability allows for investigations ranging from the macroscopic structural health monitoring of large-scale components, such as wind turbine blades and aircraft airframes (He et al., 2024), to the micromechanical analysis of strain localization at slip bands and grain boundaries (Carroll et al., 2013; Hebert & Khonsari, 2023). The most common configuration has focused on the study of fatigue from the fracture mechanics approach, specifically in the analysis of fracture mode I (Díaz et al., 2020; Sánchez et al., 2021; Tong, 2018; Vasco-Olmo et al., 2013). For this kind of tests, most reviewed implementations focus on Middle Tension (MT), Compact Tension (CT), or dog-bone specimens subjected to tension load cycles, where the surface of interest remains optically accessible during the tests. DIC has been also employed to analyse the fatigue under fracture mode II and mixed-mode scenarios, although such implementations are less frequent compared to pure opening mode studies (Tong, 2018).
To the best of the authors’ knowledge, the application of DIC to analyse fatigue phenomena in rotating bending tests —specifically under the Stress-Life (S-N) approach— remains unexplored. To address this gap, this work introduces a novel experimental setup using 3D DIC to monitor the crack initiation zone and crack opening continuously throughout the test, without interrupting it, employing high resolution cameras eliminating the need for expensive high-speed cameras. This approach aims to enhance the reliability and reproducibility of such tests by facilitating a deeper understanding of fatigue failure mechanisms, while simultaneously providing clear visualization for both analytical and educational purposes. Specifically, an optical system synchronized with the specimen’s rotation was designed and applied to hourglass-shaped specimens. Precisely, three types of specimen subjected to bending fatigue test inspired on ISO 1143:2021 have been analysed. This methodology offers significant insight into fatigue behaviour, with high relevance for industrial applications such as railway and transport sectors. The following sections detail the fundamental concepts and methodology, demonstrating how this implementation enables the measurement of critical parameters.
2. FUNDAMENTALS
2.1. Fatigue test principle
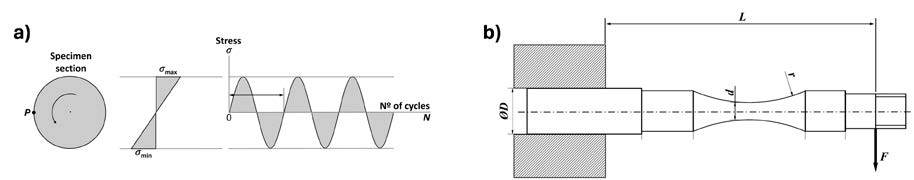
As introduced, the rotating beam fatigue test consists of subjecting a rotating specimen to a fully inversed stress recording the number of cycles required to produce its failure (fatigue life) (Budynas & Nisbett, 2020) as illustrated in Figure 1a. The rotating specimen test (International Organization for Standardization, 2021), or the Moore machine test (Figure 1b), is one of the most effective and widely used for metallic materials. It employs small circular cross-section specimens that rotate driven by an electric motor (Budynas & Nisbett, 2020).
2.2. Fatigue Analysis using the Stress-Life Method
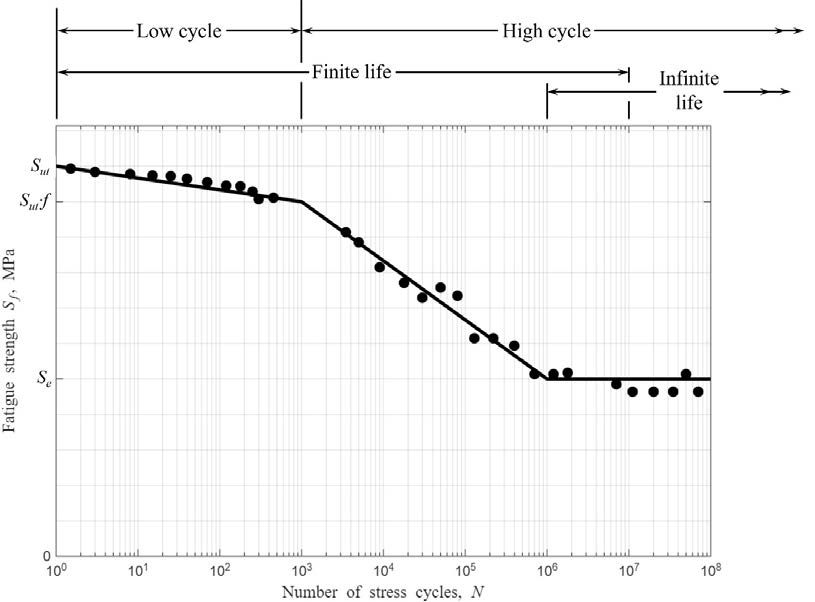
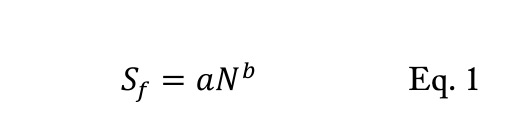
To determine the fatigue strength of a rotating beam using the stress-life method, it is essential to establish a database derived from specimens subjected to fully reversed fluctuating stresses (zero means stress). Given the inherent stochastic nature of fatigue, a substantial number of tests is required to generate a statistically significant average, though some minimum interaction with the specimen and unprecedent spatial resolution in the degree of uncertainty inevitably remains. This empirical process defines the relationship between the applied stress amplitude (S) and the expected fatigue life (N). Figure 2 illustrates a typical S-N diagram for steel resulting from a test campaign and which is generalized for its use in streels. In this plot, the ordinate axis represents the fatigue strength (Sf ), which is typically denoted with a subscript indicating the specific number of cycles at which the specimen fails (N) in logarithmic scale (Budynas & Nisbett, 2020).
As it can be observed, the life ranges from one single cycle —when an alternating stress equal to the ultimate tensile strength (Sut) is applied— to a value of 10^6 cycles when it is applied a stress of Se known as the endurance limit. Below this limit, the component is assumed to have an infinite life, typically defined as exceeding one million cycles (N#106 ). The value of Se has been analysed on a great quantity of tests in order to be related with Sut and enable further analysis. For steels under Sut=1400 MPa, it was observed that Se =0,5 Sut. It is important to note that this S_e value is defined for a specific material with a particular size, finish, or environmental conditions according to the standard employed for the rotating-beam fatigue test. To adjust this strength value when certain conditions vary respect the standard, a series of adjustment parameters is required. In this case, these are known as Marin factors and most common are related to surface condition, size, kind of load, and temperature (Budynas & Nisbett, 2020).
The range from N = 1 to N = 1,000 cycles is generally classified as low-cycle fatigue, as indicated in figure 2. Consequently, high-cycle fatigue refers to failure corresponding to stress cycles greater than 103 cycles. The in- flexion point at 103 cycles corresponds to a stress applied of (FORMULA) being f a factor which depends on the ultimate strength of the material and ranges between 0,9 and 0,77 (Budynas & Nisbett, 2020). So, the calculation of the life (N in cycles) is usually limited to applied stresses in the range between (FORMULA) and Se . In that range, the predicted life is related with the fatigue strength following the next equation:
 Where, the constants a and b are defined by the points for 103 cycles when applying (FORMULA) and 106 cycles corresponding to Se . Taking that into account in Eq.1, a and b become as followed:

![]() Following the procedure described, the number of cycles that one rotating component could withstand a certain bending stress could be calculated from the Sutvalue. It is important to note that, this procedure could also be applied to non-rotatory components or submitted to different loads from bending, adjusting the corresponding Marin factors. Additionally, when mean stress conditions are not equal to zero, different criteria exist to relate the material’s fatigue strength to specific alternating and mean stress conditions. Notable among these are the Goodman fatigue criterion, due to its simplicity, and the ASME elliptical criterion, for its better fit to experimental results (Budynas & Nisbett, 2020).
Following the procedure described, the number of cycles that one rotating component could withstand a certain bending stress could be calculated from the Sutvalue. It is important to note that, this procedure could also be applied to non-rotatory components or submitted to different loads from bending, adjusting the corresponding Marin factors. Additionally, when mean stress conditions are not equal to zero, different criteria exist to relate the material’s fatigue strength to specific alternating and mean stress conditions. Notable among these are the Goodman fatigue criterion, due to its simplicity, and the ASME elliptical criterion, for its better fit to experimental results (Budynas & Nisbett, 2020).
2.3. Digital Image Correlation
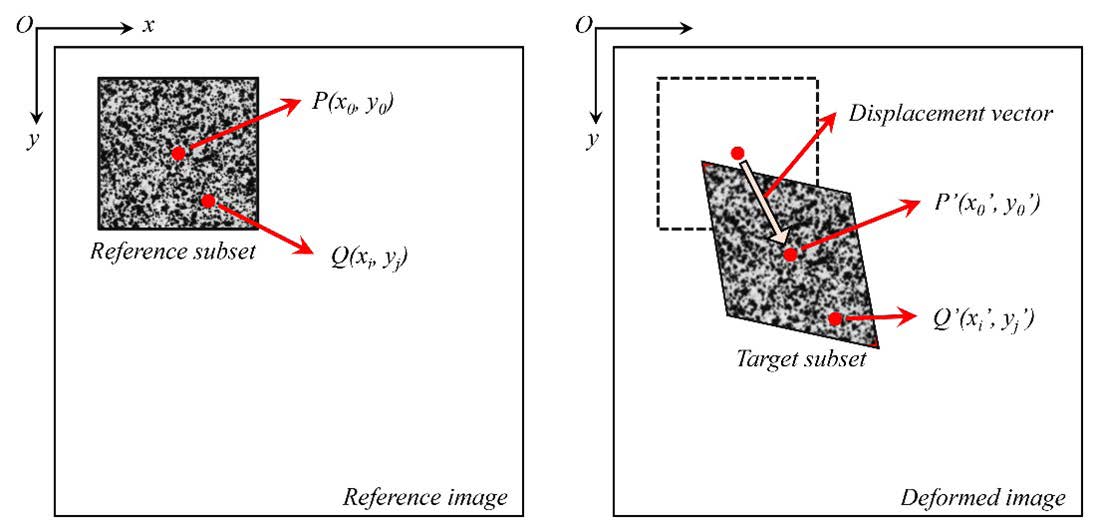
DIC is a fullfield optical technique for surface displacement measurement based on the acquisition of digital images of a specimen during its testing. The basic principle of this method consists of tracking groupings of pixels, known as subsets or facets, in the images captured during the specimen’s deformation process. To determine the displacement or strain of a point P (x0 , y0 ), a reference image is required (typically the initial state), where a subset (a square window) with dimensions of 2 M+1 pixel, where M is the distance from the reference point to the edge of the window. Subsequently, this subset is tracked in each of the captured images to establish the deformation experienced by the specimen during the test relative to the reference image (Sutton et al., 2009). To facilitate the subset tracking process, a random speckle pattern is typically generated on the surface, making a facet easily differentiable respect its neighbours. This is usually achieved by applying a base of white paint, followed by a random black speckle pattern to create the maximum possible contrast (Figure 3) (Sutton et al., 2008). The variations in the shape of this pattern throughout the test allow for the calculation of displacements and strains by comparing the specimen from its initial state (considered the reference state) to its !nal (deformed) state (Pan et al., 2009; Sutton et al., 2008; Sutton et al., 2009).
For its application, it must be noted that a single camera is used for two-dimensional displacement or strain studies; however, if a three-dimensional analysis is required, as it is the case of the study of non-«at specimens, a stereoscopic vision system is necessary to provide spatial perception. In this case, system consists of two cameras observing the same area of interest to perform the analysis (Sutton et al., 2009). In any case, the vision system requires calibration. For 2D DIC, determining the pixel-to-millimetre magnification ratio is often sufficient. However, calibration for 3D DIC is significantly more complex, as the software must determine the optical properties of each camera, as well as their orientation and position relative to one another and the specimen—namely, the intrinsic and extrinsic parameters of the optical setup. To achieve this, calibrated grid patterns are typically imaged, and correlation algorithms are applied to the images captured by both cameras. Once the relative positions are established and all imaging parameters are defined, the absolute 3D coordinates of any surface point can be calculated. By performing this calculation for every point on the object’s surface, the 3D contour can be determined across the entire field of view throughout the test. (Pan et al., 2009; Sutton et al., 2009).
3. METHODOLOGY
3.1. Specimens used
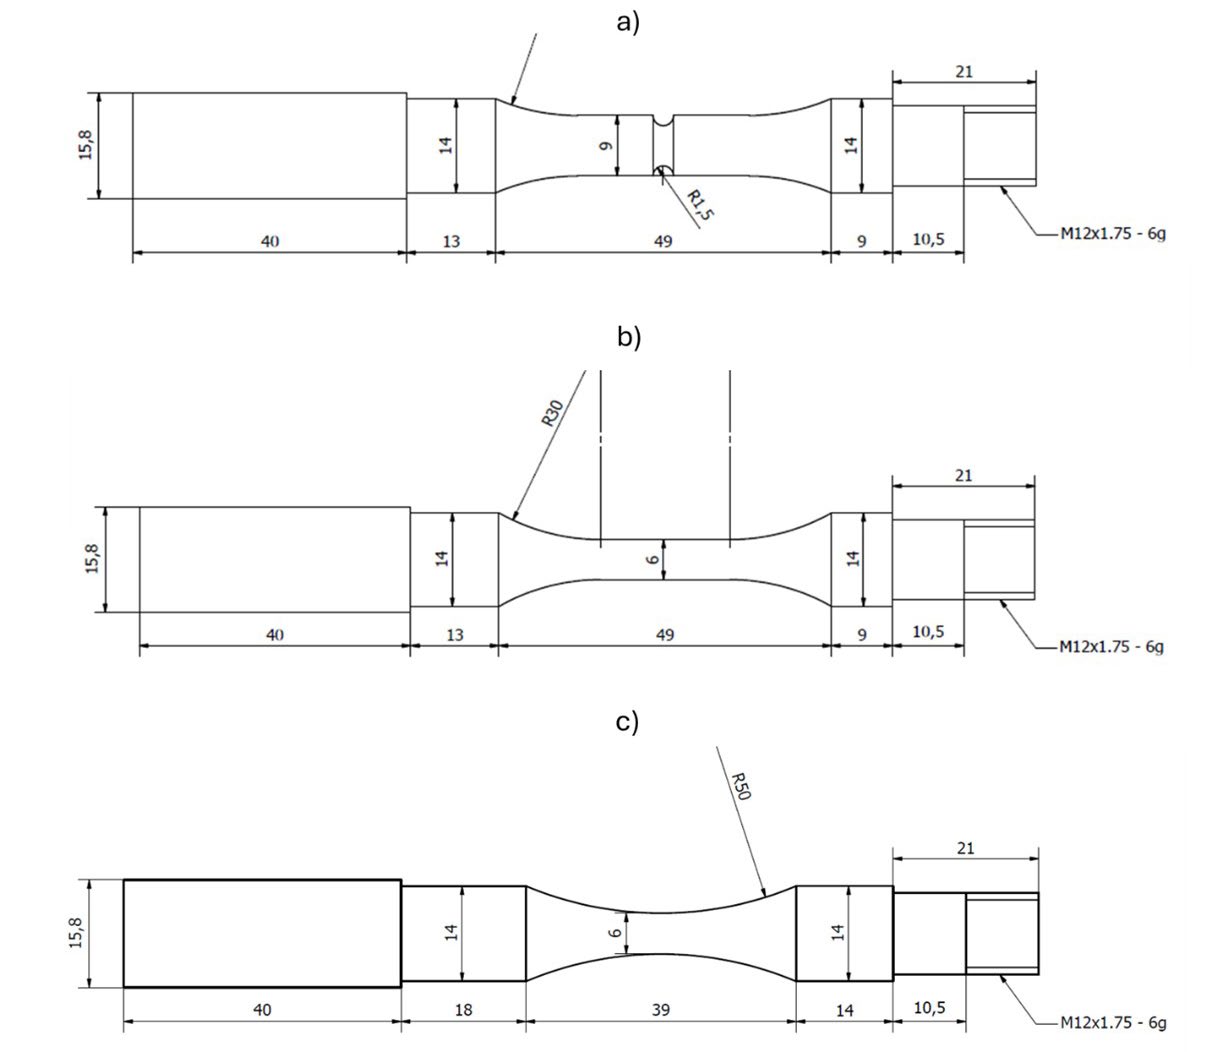
As commented, three kind of specimens were analysed during its rotating bar bending fatigue testing. Previously to the determination of the description of the experimental setup, it is important to describe the material tested. The three distinct single-point loading specimens made of steel C45 were designed based on the ISO 1143 standard as shown in figure 4. The test campaign included a cylindrical specimen (parallelsided), an hourglass-shaped specimen, and a specimen featuring a stress concentrator (diameter reduction) to assess its influence on fatigue life. Based on the geometry, material, test conditions, and specific surface finish of the specimen, the theoretical S-N diagram can be determined according to the procedure described in (Budynas & Nisbett, 2017). The ultimate strength of the steel used in the specimen, was considered as 895 MPa according to supplier. To calculate the point corresponding to N = 10$ it has to be calculated the value of (FORMULA) according to procedure previously described, leading to a value of 751,8 MPa. To calculate the value of Se adapted to the characteristics of the specimen and test, it has to be applied the Marin factors as commented. For that purpose, Eq (4) is used, where Se ’ is the original ultimate strength of the material according to the standard conditions and the k factors are the socalled Marin factors, which modify the fatigue limit due to geometry, surface finish, temperature, and other factors.
![]() The value of Se , assuming a machined surface, an ambient temperature of 20 ºC, and given the specimen geometry, is 343 MPa.
The value of Se , assuming a machined surface, an ambient temperature of 20 ºC, and given the specimen geometry, is 343 MPa.
specimen).
specimen).
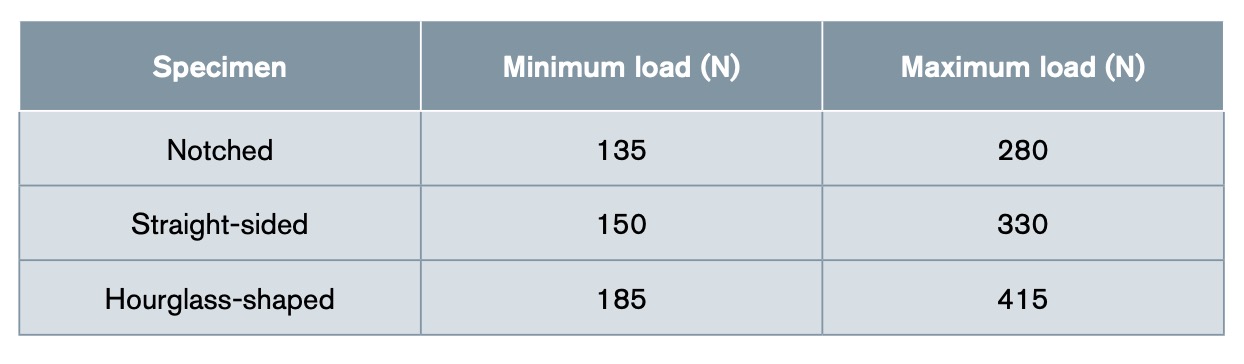
Next step is to calculate the load for each specimen to enable a stress that leads to a fatigue strength corresponding to a life between 103 >N>106 . Table 1 details the load range for each specimen. These values were selected to ensure testing within the finite life regime —specifically, maintaining stress below the ultimate tensile strength (Sut) but above the fatigue endurance limit (Se ). The values were selected in multiples of 5N, taking into account that the 40 mm length area at the left of the specimen was the clamped area and the punctual load was applied in the middle of the 21 mm length part at the right of each specimen shown in Figure 4.
3.2. Experimental set-up
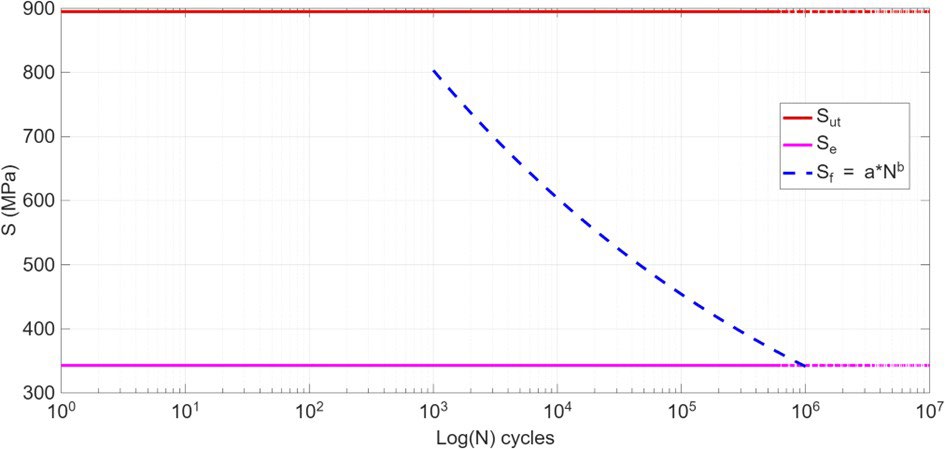
The fatigue testing machine used allows for rotating beam fatigue tests under single-point loading (cantilever bending), which is one of the methods described in the ISO 1143 standard. To achieve this, the load is applied using weights placed on a long-articulated lever arm that rests on a Hottinger Brüel & Kjaer K-U9C 2kN load cell. This load cell allows the precise measurement of the force exerted on the specimen tip. The load cell and the specimen are connected through a bearing system, which allows the specimen to rotate freely while maintaining the load static. The rotation of the specimen was controlled through a three-phase motor, commanding a rotational speed of 400 rpm for all the tests.
Regarding the image acquisition procedure, given the cylindrical geometry of the specimen and the potential for 3D displacement, the use of 3D DIC is mandatory. A key requirement of the methodology is to capture the same area of the specimen throughout the test; therefore, synchronizing the image capture with the specimen’s rotation is crucial. To compensate for minor variations in rotational speed, the cameras are triggered via a TTL pulse based on the specimen’s position. This trigger signal is generated by a photoelectric sensor pointed at the machine’s rotating component, which detects a narrow white mark on the grip system. Simultaneously, this signal is sent to an Arduino system to count the number of revolutions. Due to the high number of cycles expected on this kind of tests and, consequently, the high number of images to be stored and processed, it was decided to save and process only one every ten images, that is every ten cycles of rotation. This allowed a sufficient amount of data to observe the fatigue fracture process, while reducing storage and processing costs. For this purpose, a Python program was developed to control cameras and record one image every 10 TTL pulses.
Specifically, the optical system, consisted of two Allied Vision Mako U-130B (1,280 % 1,024 pixels) cameras equipped with 35 mm lenses. Given the high rotational speed of the specimen, a short exposure time was required to minimize motion blur; in this case 300 µs was employed. This short exposure reduced the light intensity reaching the sensor, necessitating an auxiliary lighting system to illuminate the area under study. Figure 6 illustrates both the schematic diagram and the actual experimental setup. The cameras were positioned to view the specimen from above —focusing on the zone subjected to tension where crack opening occurs— thereby, optimizing the visualization of crack initiation and propagation.
4. RESULTS AND DISCUSSION
The results obtained after testing the three specimens are shown below. Four specimens were studied of each geometry, but, for illustration purposes, DIC results from one of each type will be shown in this section.
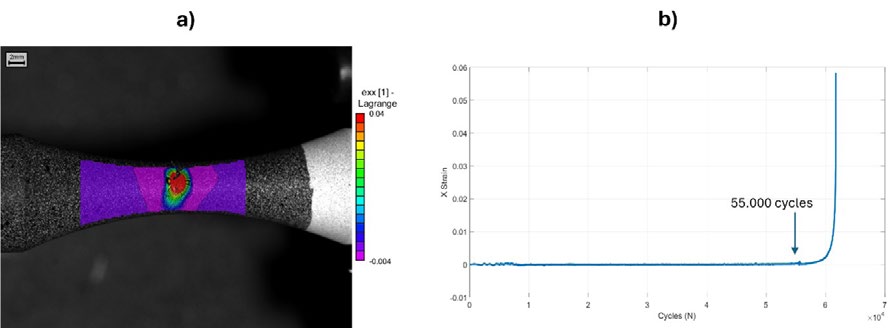
First, the hourglass specimen is studied. The mass selected for this test was 30 kg, which results in a load measured by the load cell of 285 N since the load is not totally centred on the contact point with the specimen. This load generates a maximum alternating stress of 521 MPa located at the smallest section, which, according to the S-N diagram, would imply a total of 32,850 cycles.
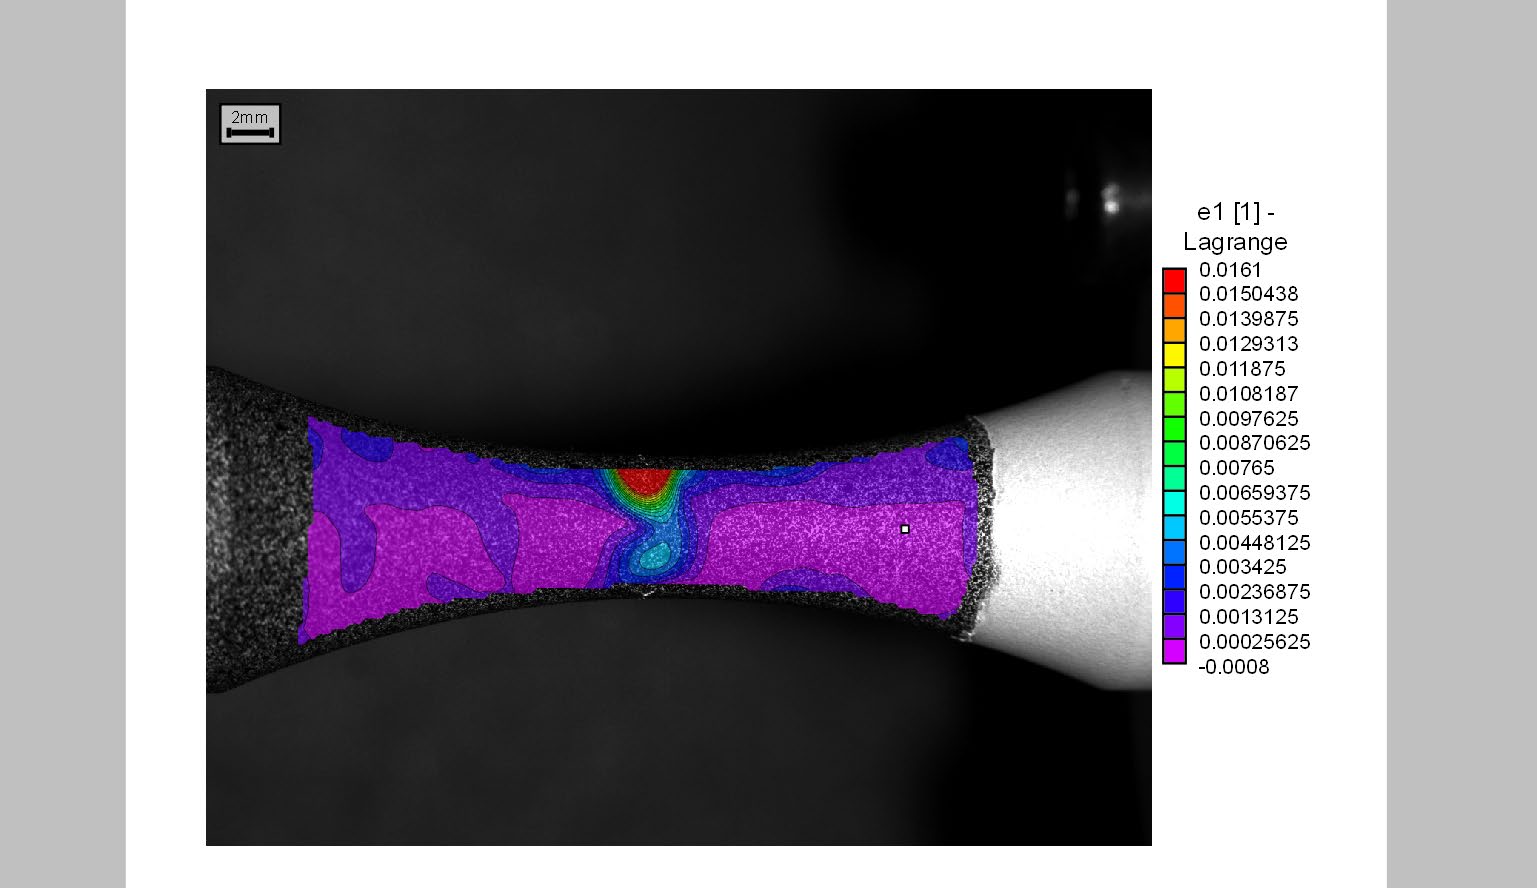
3D DIC enables the simultaneous measurement of shape, displacement, and strain. Among these, longitudinal strain proves to be the most effective indicator for detecting crack initiation. Since the cameras view the specimen laterally, the crack opening under tension manifests as a localized concentration of high positive strain. Although strain fields are inherently noisier than displacement fields due to the differentiation process required to calculated former from latter, this parameter offers superior sensitivity for identifying initiation sites. However, a theoretical distinction is necessary, strictly speaking, calculating strain across a discontinuity (the crack) is not consistent with the continuum mechanics assumptions. Therefore, these high values should be interpreted as a ‘pseudo-strain’ or damage indicator rather than a true measure of material deformation.
Fracture is expected to occur at the central point, as this is where the highest stress is generated due to it being the area of smallest cross-section. Figure 7a shows how the crack is observed in the strain map in the central section of the specimen, near the end of the test. Due to the camera viewing angle, only the zone of the specimen under tension is visible. In the lower zone, a similar distribution with negative strain values should appear, due to the compressive stress experienced.
Continuing with the strain analysis, the evolution of strain at the point of maximum strain can be obtained over the number of images until fracture, as shown in figure 7b. As it can be observed, the strain remains practically constant and positive, due to being subjected to tension throughout the test, until a point is reached where the trend changes and begins to increase at 55,000 cycles. At this moment, the crack size grows until it finally reaches a maximum value, where the specimen finally fractures. It is also observed that fracture occurred at 61,746 cycles, while the theoretical study predicted about 32,850 cycles. These differences can be attributed to the inherent uncertainty of the fatigue process or to the fact that the surface finish was not fully defined by the theoretical parameters. However, a larger test series would be necessary to draw more well-founded conclusions regarding the sources of discrepancy.
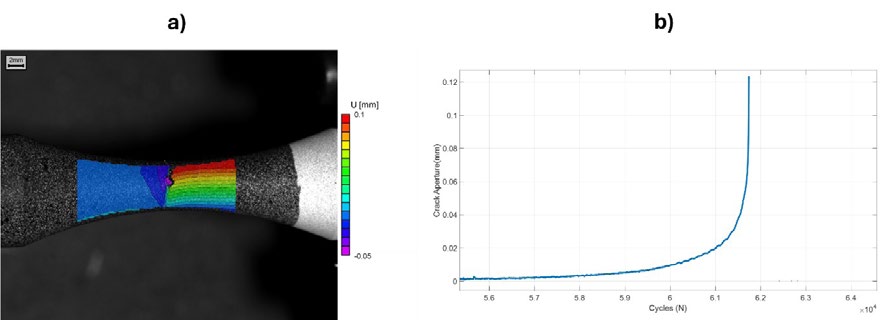
As commented, it can be considered that strain values measured do not adequately mechanically represent the event when a crack is forming; therefore, once the crack initiation point was located, its opening was measured. To this end, the displacement along the longitudinal axis of two different points on the specimen near the crack, one on each side, was monitored. The crack opening was, therefore, calculated by the difference between the displacement of one point minus the other, for each captured image. The result is shown in figure 8b. A trend similar to that of the strain is observed, in which the value is constant and practically zero until 55,000 cycles, at which point the crack width begins to increase exponentially until fracture at an opening of 0.12 mm.
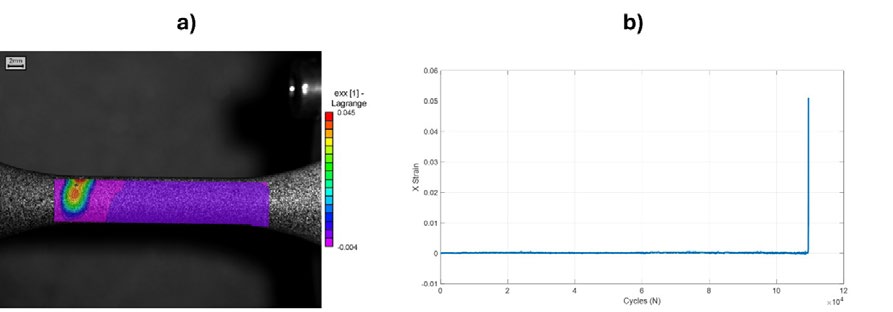
Next, the results for the parallel-sided specimen are shown below. In this test, the applied load measured by the load cell was 175 N, which corresponds to a maximum stress in the specimen of 399 MPa and an expected fatigue life of 270,000 cycles.
Figure 9a shows the longitudinal strain at a moment near the end of the test, when fatigue failure has begun to propagate. In this case, the crack did not appear in the central zone of the specimen; rather, due to the bending moment distribution, the zone sustaining the highest stress is the one with the smallest diameter located furthest from the load application point. Analysing the strain at the point of maximum strain yields the graph in figure 9b. This remains constant, similar to the hourglass specimen test, until it approaches 100,000 cycles. At this point, the strain increases exponentially due to crack opening until final fracture occurs at 109,780 cycles. In this case, there is a certain discrepancy between the theoretical and experimental cycles; however, given the uncertainty inherent to the fatigue phenomenon, this is considered an acceptable error.
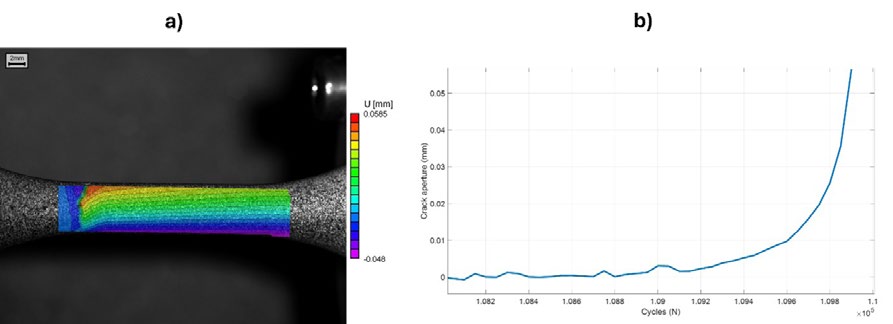
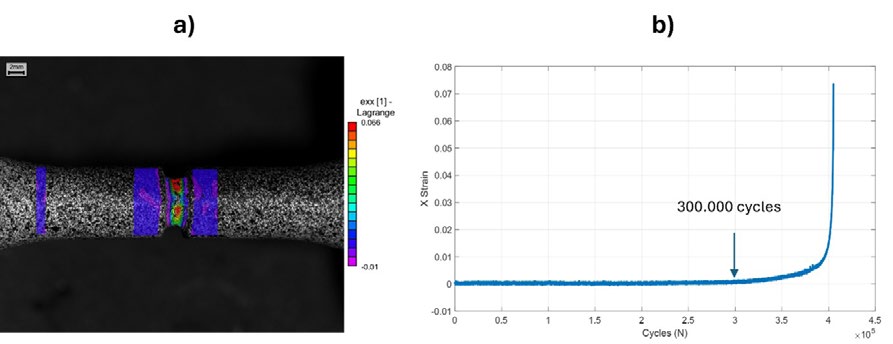
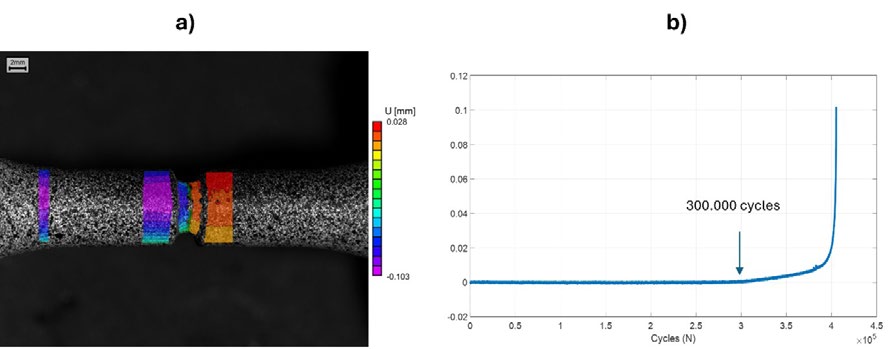
Once the crack location was determined, its opening was calculated as previous specimen. This evolution is shown in the graph in figure 10b, where it can be observed that the crack appears approximately in the last 1,000 cycles and its width grows asymptotically until specimen fracture at almost 0.06 mm of crack opening. Finally, the results for the notched specimen are shown. In this case, the measured applied load is 150 N, which corresponds to a maximum stress in the specimen at the centre of the notch, due to it having the minimum cross-section, of 274 MPa. It must be taken into account that due to the presence of the notch, a stress concentration is generated. Therefore, a stress concentration factor of Kf = 1.434 was applied so the actual stress at the notch section is finally 392.9 MPa, for which a total number of 326,000 cycles is expected. Figure 11a shows the longitudinal strain map for a moment near the fatigue fracture of the specimen. It demonstrates how the crack appears for this specimen in the notch zone, as it is the section with the smallest area and where the stress is highest. Following this, the strain is plotted for the point of maximum value as a function of the number of cycles, obtaining the curve in figure 11b. The strain remains constant and practically negligible throughout the test until reaching 300,000 cycles. From this point onwards, the value begins to increase exponentially until final fracture at 400,700 cycles. In this instance, crack initiation was detected after 75% of the test had elapsed, unlike in previous tests, in which the strain remained constant almost until specimen fracture.
Finally, the graph of crack opening as a function of the number of cycles is shown in figure 12b. A trend similar to that of the strain is observed, with the crack beginning to widen starting from 300,000 cycles until its total failure with an opening of 0.1 mm.
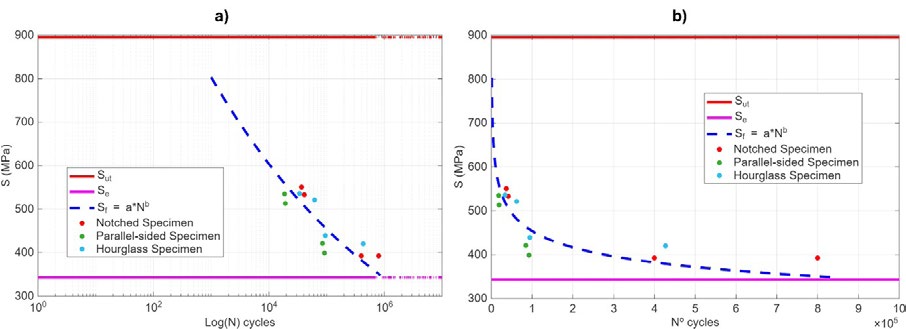
As previously noted, three replicate tests were conducted for each specimen type to ensure data robustness and assess dispersion. Figure 13 presents the S-N diagram alongside the experimental results, plotting maximum sustained stress against the number of cycles to failure. Despite some deviation between the predicted values and the measured experimental life, the theoretical curve shows good agreement with the data. The observed scatter is attributed to the inherent stochastic nature of the fatigue phenomenon and deviation previously noted are consistent with the general tendency. This sensitivity is more evident in figure 13b (linear scale), which clearly illustrates how minor variations in stress amplitude can lead to significant variations in fatigue life.
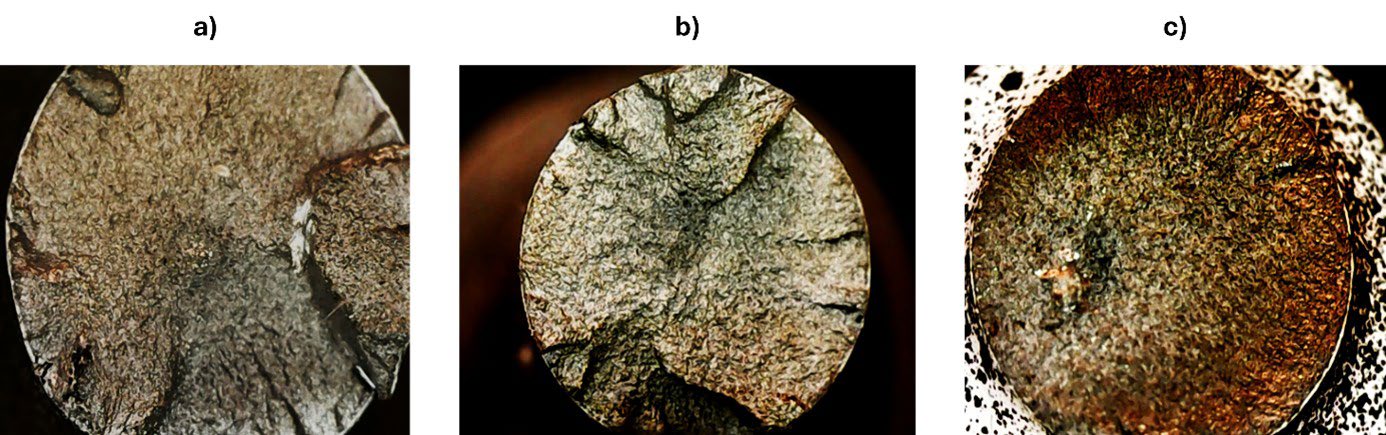
Finally, an analysis of the fracture surface was conducted to assess the failure mechanism. Figure 14 shows the cross sections of the three types of specimens tested. In all cases, the surfaces exhibit the characteristic features of rotating bending fatigue: a smooth, dull region corresponding to the stable crack propagation stage, and a rougher texture representing the !nal and abrupt fracture area.
5 .CONCLUSIONS
This study presents a novel experimental setup for monitoring the rotating beam fatigue process, employing fullfield optical techniques to observe displacements and strains across the entire surface. Furthermore, the crack opening and propagation processes were successfully monitored using the 3D DIC analysis derived from these images.
Specifically, the study quantified crack opening and its influence on local strain fields. Observations revealed that crack growth remains latent and virtually undetectable for the majority of the test life, until a critical cycle count is reached, triggering exponential propagation until fracture. Higher resolution images could detect previous stages. This behaviour underscores the importance of reliable monitoring procedures prioritizing high-resolution data acquisition over high-speed cameras, which typically suffer from lower spatial resolution. Additionally, future research could analyse the relationship between specimen tip displacement and crack depth as an indirect measurement method.
Consequently, leveraging the fullfield capabilities of DIC, this work establishes a robust tool for precise fatigue analysis. This methodology holds significant potential for both future research and industrial applications, particularly in predicting component service life and performing in-service inspections aligned with Structural Health Monitoring (SHM) strategies. Ultimately, this approach aims to bridge the gap between theoretical models and experimental reality through high-fidelity data collection.
ACKNOWLEDGMENTS
This research is part of the Project I+D+i PID2022-141618OA-I00 INTEGROPTICS founded by MCIN PID2022-141618OA-I00, FEDER, UE.
Authors also acknowledge the grant Ayudas de Iniciación a la Investigación. Acción 2 2023 from Universidad de Jaén.
REFERENCES
Budynas, R. G., & Nisbett, J. K. (2017). Diseño de Ingeniería Mecánica de Shigley (8.a ed.). Mc Graw Hill.
Campbell, J., & , M. (2022). Fatigue Failure in Engineered Components and How It Can Be Eliminated: Case Studies on the Influence of Bifilms. Metals, 12(8). https://doi.org/10.3390/ met12081320.
Carpinteri, A., Brighenti, R., & Spagnoli, A. (2000). Fatigue growth simulation of part-through «aws in thick-walled pipes under rotary bending. International Journal of Fatigue, 22(1), 1-9. https://doi.org/10.1016/S0142- 1123(99)00115-2.
Carroll, J. D., Abuzaid, W., Lambros, J., & Sehitoglu, H. (2013). High resolution digital image correlation measurements of strain accumulation in fatigue crack growth. International Journal of Fatigue, 57, 140-150. https://doi. org/10.1016/j.ijfatigue.2012.06.010.
Chandan, K., & Vikas, R. (2009). A Brief Review on Dynamics of a Cracked Rotor. International Journal of Rotating Machinery, 2009. https:// doi.org/10.1155/2009/758108.
De Freitas, M., & François, D. (1995). Analysis of Fatigue Crack Growth in Rotary Bend Specimens and Railway Axles. Fatigue & Fracture of Engineering Materials & Structures, 18(2), 171-178. https:// doi.org/10.1111/j.1460-2695.1995. tb00152.x.
Díaz, F. A., Vasco-Olmo, J. M., López-Alba, E., Felipe-Sesé, L., Molina-Viedma, A. J., & Nowell, D. (2020). Experimental evaluation of effective stress intensity factor using thermoelastic stress analysis and digital image correlation. International Journal of Fatigue, 135, 105567. https:// doi.org/https://doi.org/10.1016/j. ijfatigue.2020.105567.
He, X., Zhou, R., Liu, Z., Yang, S., Chen, K., & Li, L. (2024). Review of research progress and development trend of digital image correlation. En Multidiscipline Modeling in Materials and Structures (Vol. 20, N. 1, pp. 81- 114). Emerald Publishing. https:// doi.org/10.1108/MMMS-07-2023- 0242.
Hebert, J., & Khonsari, M. (2023). The application of digital image correlation (DIC) in fatigue experimentation: A review. Fatigue and Fracture of Engineering Materials and Structures, 46(4), 1256-1299. https://doi.org/10.1111/ ffe.13931.
International Organization for Standardization. (2021). ISO 1143:2021 Metallic materials — Rotating bar bending fatigue testing. 2021. Kepka, M.,
Kepka, M., & Minich, R. (2024). A case study on fatigue life assessment of an electric bus bodywork. International Journal of Fatigue, 179. https://doi.org/10.1016/j. ijfatigue.2023.108040.
Lee, Y. L., Pan, J., Hathaway, R. B., & Barkey, M. E. (2004a). Fatigue testing and analysis: Theory and practice. En Fatigue Testing and Analysis: Theory and Practice. https://doi.org/10.1016/B978-0- 7506-7719-6.X5000-3.
Molina-Viedma, Á. J., López-Alba, E., Felipe-Sesé, L., & Díaz, F. A. (2018). Modal identi!cation in an automotive multi-component system using HS 3D-DIC. Materials, 11(2). https://doi. org/10.3390/ma11020241.
Molina-Viedma, Á. J., López-Alba, E., Felipe-Sesé, L., Díaz, F. A., Rodríguez-Ahlquist, J., & Iglesias-Vallejo, M. (2018). Modal Parameters Evaluation in a FullScale Aircraft Demonstrator under Different Environmental Conditions Using HS 3D-DIC. Materials, 11(2). https://doi. org/10.3390/ma11020230.
Niezrecki, C., Baqersad, J., & Sabato, A. (2018). Digital Image Correlation Techniques for NDE and SHM. En Handbook of Advanced NonDestructive Evaluation. https:// doi.org/10.1007/978-3-319-30050- 4_47-1.
Oberreiter, M., Horvath, M., Stoschka, M., & Fladischer, S. (2023). Effect of Surface Finishing State on Fatigue Strength of Cast Aluminium and Steel Alloys. Materials, 16(13). https://doi. org/10.3390/ma16134755.
Palanca, M., Tozzi, G., & Cristofolini, L. (2016). The use of digital image correlation in the biomechanical area: A review. En International Biomechanics (Vol. 3, N. 1, pp. 1-21). Taylor and Francis Ltd. https://doi.org/10.1080/23335432.2 015.1117395.
Pan, B. (2011). Recent Progress in Digital Image Correlation. Experimental Mechanics, 51(7), 1223-1235. https://doi.org/10.1007/ s11340-010-9418-3.
Pan, B., Qian, K., Xie, H., & Asundi, A. (2009). Two-dimensional digital image correlation for in-plane displacement and strain measurement: a review. Measurement Science and Technology, 20(6), 62001. https://doi.org/10.1088/0957- 0233/20/6/062001.
Rastogi, V., & Kumar, C. (2009). A brief review on dynamics of a cracked rotor. International Journal of Rotating Machinery, 2009. https:// doi.org/10.1155/2009/758108.
Sánchez, M., Mallor, C., Canales, M., Calvo, S., & Núñez, J. L. (2021). Digital Image Correlation parameters optimized for the characterization of fatigue crack growth life. Measurement: Journal of the International Measurement Confederation, 174. https://doi.org/10.1016/j. measurement.2021.109082.
Smith, R. A., & Hillmansen, S. (2004). A brief historical overview of the fatigue of railway axles. Proceedings of the Institution of Mechanical Engineers, Part F: Journal of Rail and Rapid Transit, 218(4), 267-277. https://doi. org/10.1243/0954409043125932.
Suresh, S. (1998). Fatigue of materials (2.a ed.). Cambridge University Press.
Sutton, M. A., Orteu, J. J., & Schreier, H. (2009a). Image correlation for shape, motion and deformation measurements: Basic concepts, theory and applications. En Image Correlation for Shape, Motion and Deformation Measurements: Basic Concepts,Theory and Applications. Springer US. https:// doi.org/10.1007/978-0-387-78747- 3.
Sutton, M., Yan, J., Tiwari, V., Schreier, H., & Orteu, J.-J. (2008). The Effect of Out of Plane Motion on 2D and 3D Digital Image Correlation Measurements. Optics and Lasers in Engineering, 46, 746-757. https://doi.org/10.1016/j. optlaseng.2008.05.005.
Tong, J. (2018). Full-!eld characterisation of crack tip deformation and fatigue crack growth using digital image correlation—a review. En Fatigue and Fracture of Engineering Materials and Structures (Vol. 41, N. 9, pp. 1855-1869). Blackwell Publishing Ltd. https://doi. org/10.1111/ffe.12859.
Tridello, A., Boursier Niutta, C., Rossetto, M., Berto, F., & Paolino, D. S. (2022). Statistical models for estimating the fatigue life, the stress–life relation, and the P-S–N curves of metallic materials in Very High Cycle Fatigue: A review. Fatigue and Fracture of Engineering Materials and Structures, 45(2), 332-370. https:// doi.org/10.1111/ffe.13610.
Tridello, A., Boursier Niutta, C., Rossetto, M., Berto, F., & Paolino, D. S. (2025). Fatigue Design Curves for Industrial Applications: A Review. En Fatigue and Fracture of Engineering Materials and Structures (Vol. 48, N. 3, pp. 1001- 1021). John Wiley and Sons Inc. https://doi.org/10.1111/ffe.14545.
Vanlanduit, S., Vanherzeele, J., Longo, R., & Guillaume, P. (2009). A digital image correlation method for fatigue test experiments. Optics and Lasers in Engineering, 47(3-4), 371-378. https://doi.org/10.1016/j. optlaseng.2008.03.016.
Vasco-Olmo, J., Díaz, F., GarcíaCollado, A., & Dorado, R. (2013). Experimental evaluation of crack shielding during fatigue crack growth using digital image correlation. Fatigue & Fracture of Engineering Materials & Structures, 38. https://doi. org/10.1111/ffe.12136.